Full Report
The numbers behind Verizon Communications Inc.: as-reported financial statements and company metrics for FY2021–FY2025, traced to the source filings, opened with the share-price history those statements have to justify. Every linked figure opens the exact page of the filing it was printed on, with the statement row highlighted. Amounts in US$ millions unless noted.
Reading notes: Main-column figures (FY2021–FY2025) are taken from each fiscal year's own Form 10-K, first reported column: income statement and cash-flow statement print three years, the balance sheet two years. Revenue breakdown uses Verizon's two reportable segments (Consumer and Business). Segment 'Total Operating Revenues' include intersegment revenues; the reconciliation adds Corporate and other and subtracts Eliminations to reach Consolidated Operating Revenues, which ties to Total Operating Revenues on the income statement. FY2021 Corporate and other operating revenue ($7,722M) is elevated versus later years because it then included Verizon Media and other businesses subsequently divested/reallocated; FY2021 and FY2022 segment figures are cited to the FY2022 Form 10-K (which reports 2022/2021/2020). Segment operating income (segment_profit) is shown only for FY2023–FY2025 on the current segment-reporting basis; the segment expense/operating-income methodology changed with the FY2025 presentation (ASU 2023-07 and centrally-managed cost allocation), so FY2021–FY2022 segment operating income is not comparable and is omitted.
Share Price — Full Available History — 43 Years
The stock closed at $46.38 on Jul 24, 2026 — up 487% over the window shown (+4.2% a year), trading between $7.32 and $62.50. At that close the stock trades at 11× FY2025 diluted EPS as reported below.
Source: market price feed, monthly closes, sampled from 10,752 source observations, Nov 1983–Jul 2026. Price return only, excludes dividends. Prices are split-adjusted (1:2 on Apr 18, 1986; 1:2 on May 02, 1990; 1:2 on Jun 30, 1998; ×1.03806 on Nov 20, 2006; ×1.00465 on Apr 01, 2008; ×1.06622 on Jul 02, 2010).
Market capitalization $189.5bn and enterprise value $189.1bn.
Market cap = 4.09B shares outstanding × the Jul 24, 2026 close of $46.38. Enterprise value adds total debt of $18.6bn and subtracts cash and equivalents of $19.0bn (net cash of $430mn), from the FY2025 balance sheet. Market-derived figures, shown without filing links.
FY2025 at a Glance
Revenue (US$ millions)
Operating income (US$ millions)
Net income (US$ millions)
Diluted EPS
Source: FY2025 consolidated statements [1] [2] [3] [4]. Click any linked figure to open the filing page with the row highlighted.
Operating Revenues by Segment
| Operating Revenues by Segment | FY2021 | FY2022 | FY2023 | FY2024 | FY2025 |
|---|---|---|---|---|---|
| Verizon Consumer Group | 95,300 | 103,506 | 101,626 | 102,904 | 106,807 |
| Verizon Business Group | 31,042 | 31,072 | 30,122 | 29,531 | 29,069 |
| Total reportable segments | 126,342 | 134,578 | 131,748 | 132,435 | 135,876 |
| Corporate and other | 7,722 | 2,510 | 2,479 | 2,609 | 2,642 |
| Eliminations | (451) | (253) | (253) | (256) | (327) |
| Consolidated Operating Revenues | 133,613 | 136,835 | 133,974 | 134,788 | 138,191 |
| Consolidated Operating Revenues growth, derived | — | +2.4% | -2.1% | +0.6% | +2.5% |
Source: Note 12 Segment Information — segment operating revenues and reconciliation to consolidated operating revenues (segment totals include intersegment revenues) [5] [6] [7] [8]. Click any linked figure to open the filing page with the row highlighted.
Segment Operating Income
| Segment Operating Income | FY2021 | FY2022 | FY2023 | FY2024 | FY2025 |
|---|---|---|---|---|---|
| Verizon Consumer Group | — | — | 29,011 | 29,484 | 29,628 |
| Verizon Business Group | — | — | 2,066 | 2,058 | 2,532 |
| Total reportable segments | — | — | 31,077 | 31,542 | 32,160 |
Source: Note 12 Segment Information — reportable-segment operating income (current segment-reporting basis; shown FY2023–FY2025) [6] [7] [8]. Click any linked figure to open the filing page with the row highlighted.
Income Statement
Source: Consolidated Statements of Income [1] [2] [3] [4]. Click any linked figure to open the filing page with the row highlighted.
Columns marked E are consensus analyst estimates from S&P Capital IQ (CapIQ), shown alongside reported results for direct comparison; they are not company guidance.
Estimate source: S&P Capital IQ (CapIQ) consensus, as of 2026-07-25. Estimate figures are S&P Capital IQ consensus (vendor data — no filing page links). EPS and net income use the normalized (adjusted) consensus where the street reports it. Line-item analyst models (segments, drivers, KPIs) are in the Visible Alpha tab.
Balance Sheet
Source: Consolidated Balance Sheets [9] [10] [11] [12]. Click any linked figure to open the filing page with the row highlighted.
Cash Flow
Source: Consolidated Statements of Cash Flows [13] [14] [15] [16]. Click any linked figure to open the filing page with the row highlighted.
Consumer — Wireless Postpaid Metrics
| Consumer — Wireless Postpaid Metrics | FY2021 | FY2022 | FY2023 | FY2024 | FY2025 |
|---|---|---|---|---|---|
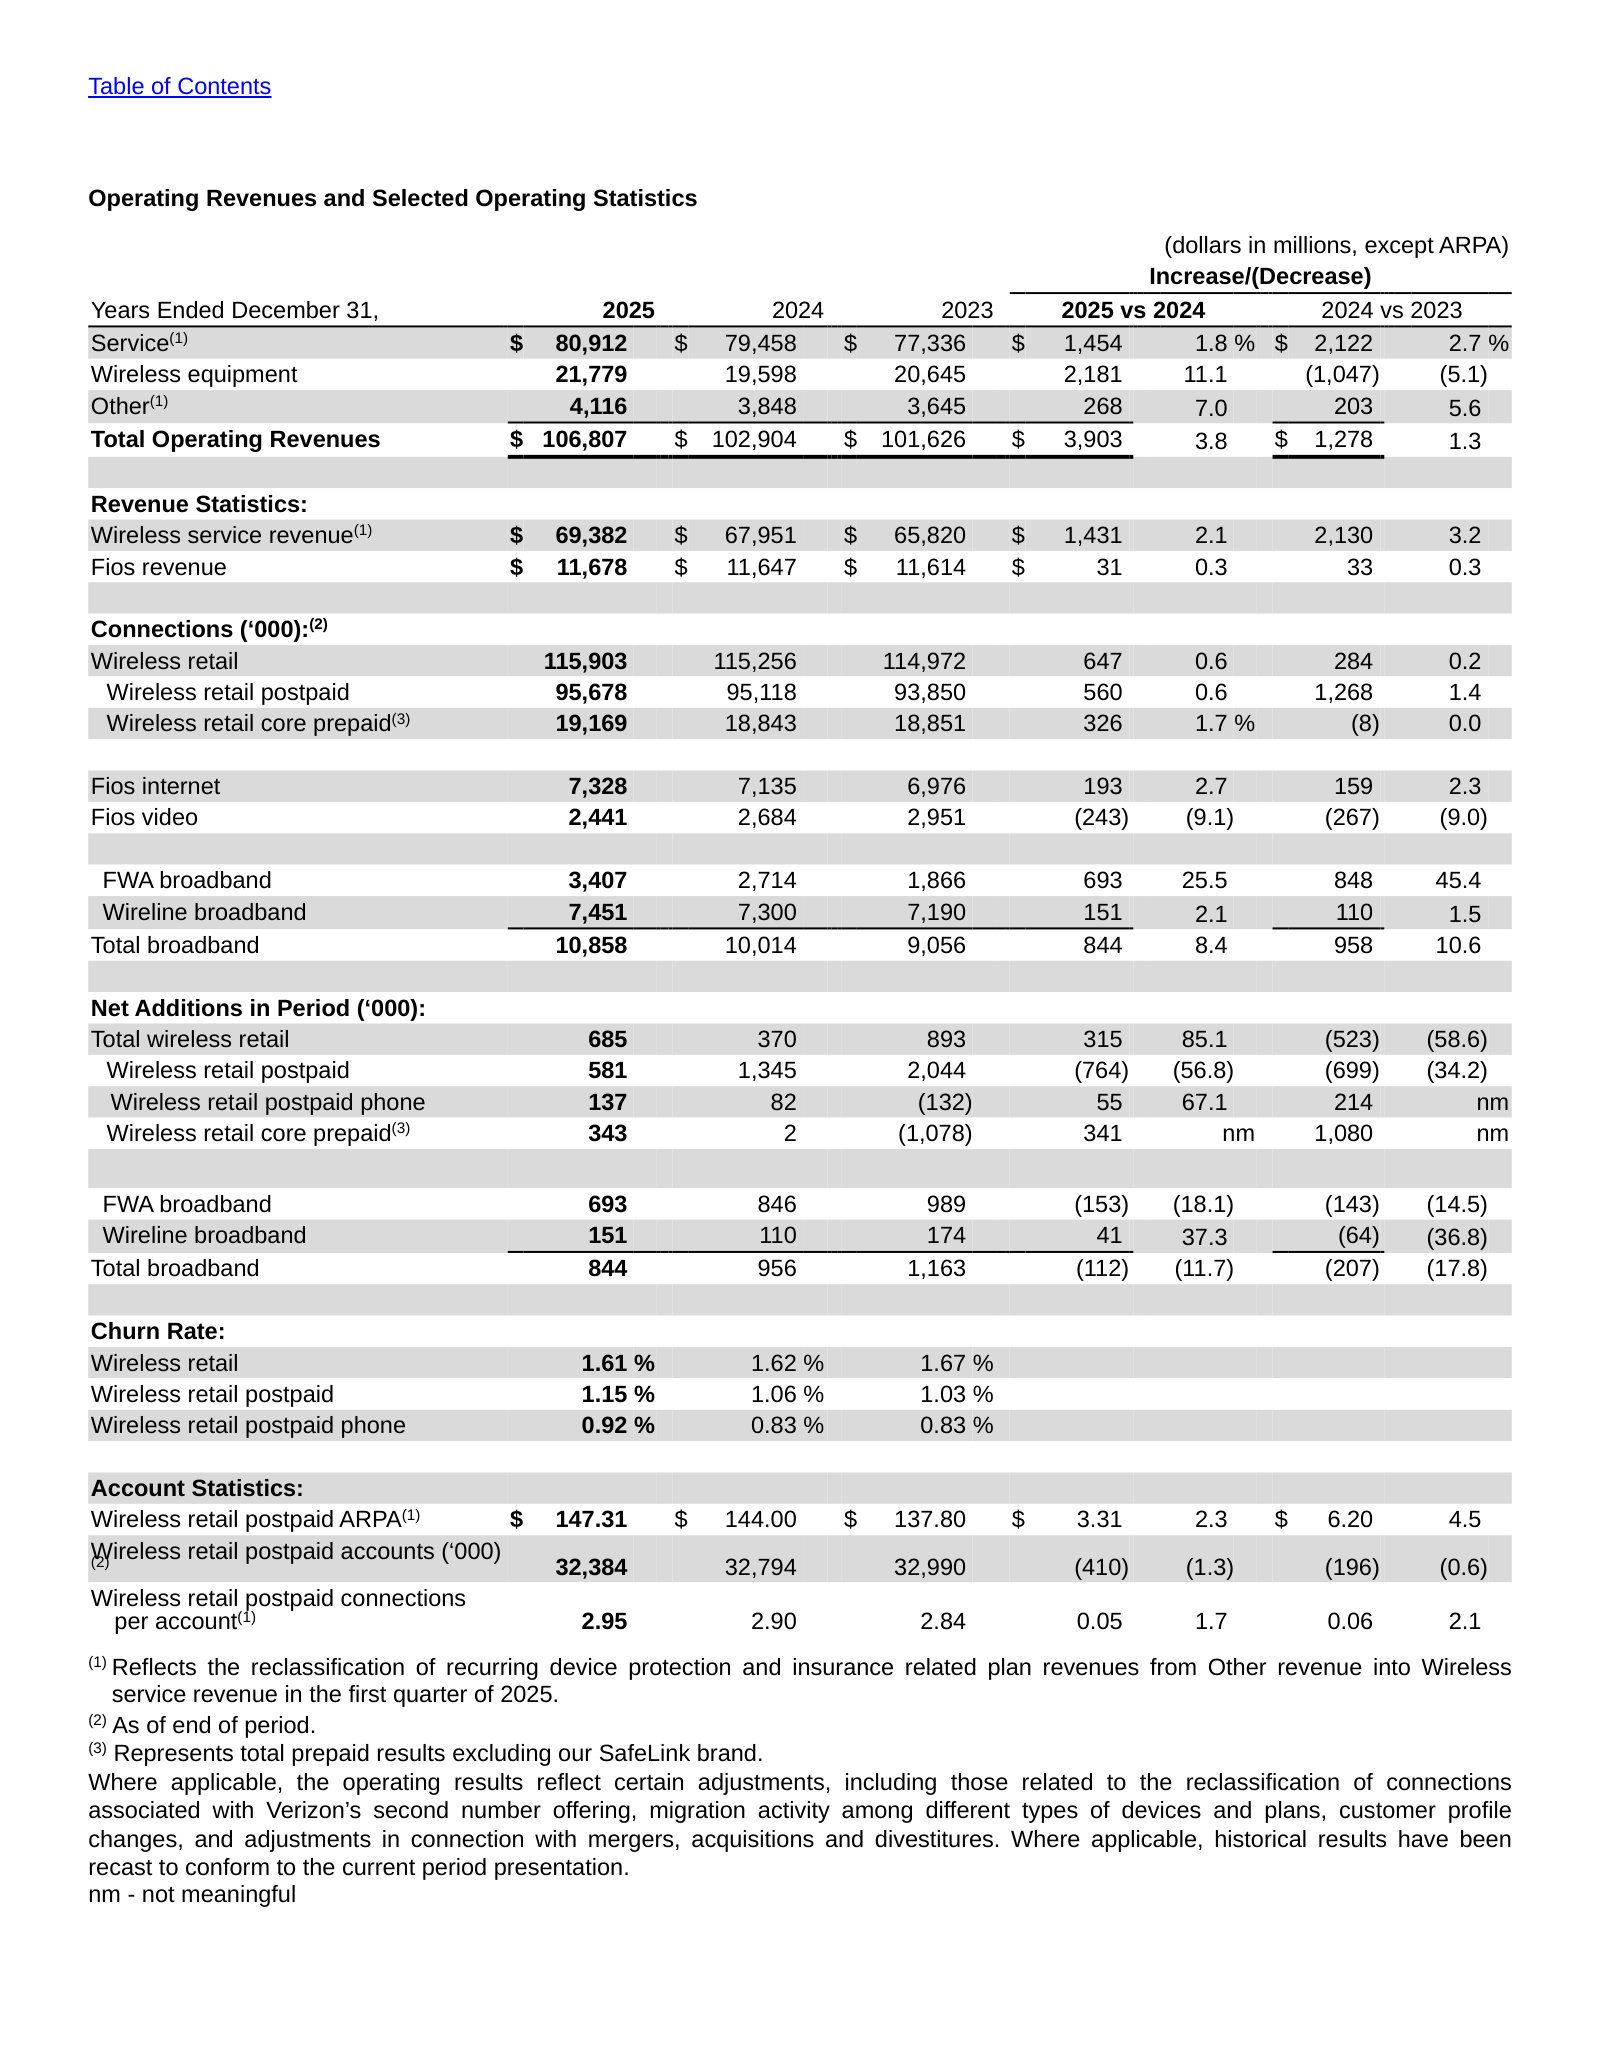
| Wireless retail postpaid connections ('000) | — | — | 93,850 | 95,118 | 95,678 |
| Wireless retail postpaid ARPA (US$/account) | — | — | 137.80 | 144.00 | 147.31 |
| Wireless retail postpaid churn | — | — | 1.0% | 1.1% | 1.1% |
| Wireless retail postpaid phone churn | — | — | 0.8% | 0.8% | 0.9% |
| Wireless retail postpaid phone net additions ('000) | — | — | (132) | 82 | 137 |
| Wireless service revenue — Consumer | — | — | 65,820 | 67,951 | 69,382 |
Source: company filings [17]. Click any linked figure to open the filing page with the row highlighted.
Consumer — Broadband Fios
| Consumer — Broadband Fios | FY2021 | FY2022 | FY2023 | FY2024 | FY2025 |
|---|---|---|---|---|---|
| Total broadband connections ('000) | — | — | 9,056 | 10,014 | 10,858 |
| FWA broadband connections ('000) | — | — | 1,866 | 2,714 | 3,407 |
| Fios internet connections ('000) | — | — | 6,976 | 7,135 | 7,328 |
| Fios video connections ('000) | — | — | 2,951 | 2,684 | 2,441 |
| Total broadband net additions ('000) | — | — | 1,163 | 956 | 844 |
| Fios revenue — Consumer | — | — | 11,614 | 11,647 | 11,678 |
Source: company filings [17]. Click any linked figure to open the filing page with the row highlighted.
Business Segment KPIs
| Business Segment KPIs | FY2021 | FY2022 | FY2023 | FY2024 | FY2025 |
|---|---|---|---|---|---|
| Wireless retail postpaid connections ('000) | — | — | 29,779 | 30,819 | 31,027 |
| Wireless retail postpaid churn | — | — | 1.5% | 1.5% | 1.6% |
| Total broadband connections ('000) | — | — | 1,661 | 2,313 | 2,772 |
| FWA broadband connections ('000) | — | — | 1,201 | 1,854 | 2,320 |
| Wireless service revenue — Business | — | — | 13,714 | 14,122 | 14,321 |
Source: company filings [18]. Click any linked figure to open the filing page with the row highlighted.
Profitability, Free Cash Flow Capital Returns
| Profitability, Free Cash Flow Capital Returns | FY2021 | FY2022 | FY2023 | FY2024 | FY2025 |
|---|---|---|---|---|---|
| Consolidated Adjusted EBITDA | 48,380 | 47,870 | 47,789 | 48,791 | 49,997 |
| Free cash flow | 19,253 | 14,054 | 18,708 | 19,822 | 20,126 |
| Cash dividends declared per common share | 2.54 | 2.58 | 2.63 | 2.69 | 2.73 |
Source: company filings [19] [20] [21] [22]. Click any linked figure to open the filing page with the row highlighted.
Long-Term Record
| Fiscal year | Total revenue | Operating income | Net income attributable to Verizon | Diluted earnings per share | Operating cash flow | Capital expenditures |
|---|---|---|---|---|---|---|
| FY2016 | 125,980 | 29,249 | 13,127 | 3.21 | 21,689 | — |
| FY2017 | 126,034 | 27,425 | 30,101 | 7.36 | 24,318 | — |
| FY2018 | 130,863 | 22,278 | 15,528 | 3.76 | 34,339 | — |
| FY2019 | 131,868 | 30,378 | 19,265 | 4.65 | 35,746 | 17,939 |
| FY2020 | 128,292 | 28,798 | 17,801 | 4.30 | 41,768 | 18,192 |
| FY2021 | 133,613 | 32,448 | 22,065 | 5.32 | 39,539 | 20,286 |
| FY2022 | 136,835 | 30,467 | 21,256 | 5.06 | 37,141 | 23,087 |
| FY2023 | 133,974 | 22,877 | 11,614 | 2.75 | 37,475 | 18,767 |
| FY2024 | 134,788 | 28,686 | 17,506 | 4.14 | 36,912 | 17,090 |
| FY2025 | 138,191 | 29,259 | 17,174 | 4.06 | 37,137 | 17,011 |
Source: consolidated statements across filings; older years from the standardized feed [13] [1] [14] [2]. Click any linked figure to open the filing page with the row highlighted.
Operating KPIs
| KPI | FY2021 | FY2022 | FY2023 | FY2024 | FY2025 |
|---|---|---|---|---|---|
| Consumer wireless retail postpaid connections | — | — | 93,850,000 | 95,118,000 | 95,678,000 |
| Consumer total broadband connections | — | — | 9,056,000 | 10,014,000 | 10,858,000 |
| Consumer Fios revenue | — | — | 11,614 | 11,647 | 11,678 |
Source: company-reported operating metrics [17]. Click any linked figure to open the filing page with the row highlighted.
Analyst Consensus
Mean target
Median target
High target
Low target
Street ratings: 8 strong buy, 3 buy, 15 hold. Consensus: Buy.
Estimate source: S&P Capital IQ (CapIQ) consensus, as of 2026-07-25. Estimate figures are S&P Capital IQ consensus (vendor data — no filing page links). EPS and net income use the normalized (adjusted) consensus where the street reports it. Line-item analyst models (segments, drivers, KPIs) are in the Visible Alpha tab.
Traceability
380 of 411 figures on this page (92%) link to the filing page where they are printed — click a linked figure to open the source PDF at that page with the row highlighted. Unlinked figures come from standardized data feeds or pre-filing years.
Main-column figures (FY2021–FY2025) are taken from each fiscal year's own Form 10-K, first reported column: income statement and cash-flow statement print three years, the balance sheet two years.
Revenue breakdown uses Verizon's two reportable segments (Consumer and Business). Segment 'Total Operating Revenues' include intersegment revenues; the reconciliation adds Corporate and other and subtracts Eliminations to reach Consolidated Operating Revenues, which ties to Total Operating Revenues on the income statement.
FY2021 Corporate and other operating revenue ($7,722M) is elevated versus later years because it then included Verizon Media and other businesses subsequently divested/reallocated; FY2021 and FY2022 segment figures are cited to the FY2022 Form 10-K (which reports 2022/2021/2020).
Segment operating income (segment_profit) is shown only for FY2023–FY2025 on the current segment-reporting basis; the segment expense/operating-income methodology changed with the FY2025 presentation (ASU 2023-07 and centrally-managed cost allocation), so FY2021–FY2022 segment operating income is not comparable and is omitted.
In Q1 2025 Verizon reclassified recurring device protection and insurance plan revenue from Other into Wireless service revenue (applied retrospectively to 2023 and 2024); this affects the Consumer service/other split but not segment or consolidated totals.
FY2016–FY2020 long-term-record figures come from the standardized SEC XBRL data feed and are shown without page links. Capital expenditures for FY2016–FY2018 are not shown (not carried in the feed).
Quarterly cash flows and Q4 FY25 income are derived from printed year-to-date / full-year statements as noted on each quarterly table; all derived values reconcile exactly and were cross-checked against the quarterly data feed.
No material figure-level discrepancies were found between the filings and the numeric data feed (agreement within rounding across revenue, operating income, net income, EPS, operating cash flow and balance-sheet totals).
Verizon Communications Inc.'s management explains the business in its own materials. The slides below do the most of that work, pulled from the documents preserved in Sources. Each source link opens the complete presentation at that slide in a new tab.
Second Quarter 2026 Earnings — Q2 2026
The most current snapshot: where subscriber, revenue and cash-flow trends sit today, and the first year with the Frontier deal closed and buybacks running. · Open the full document →
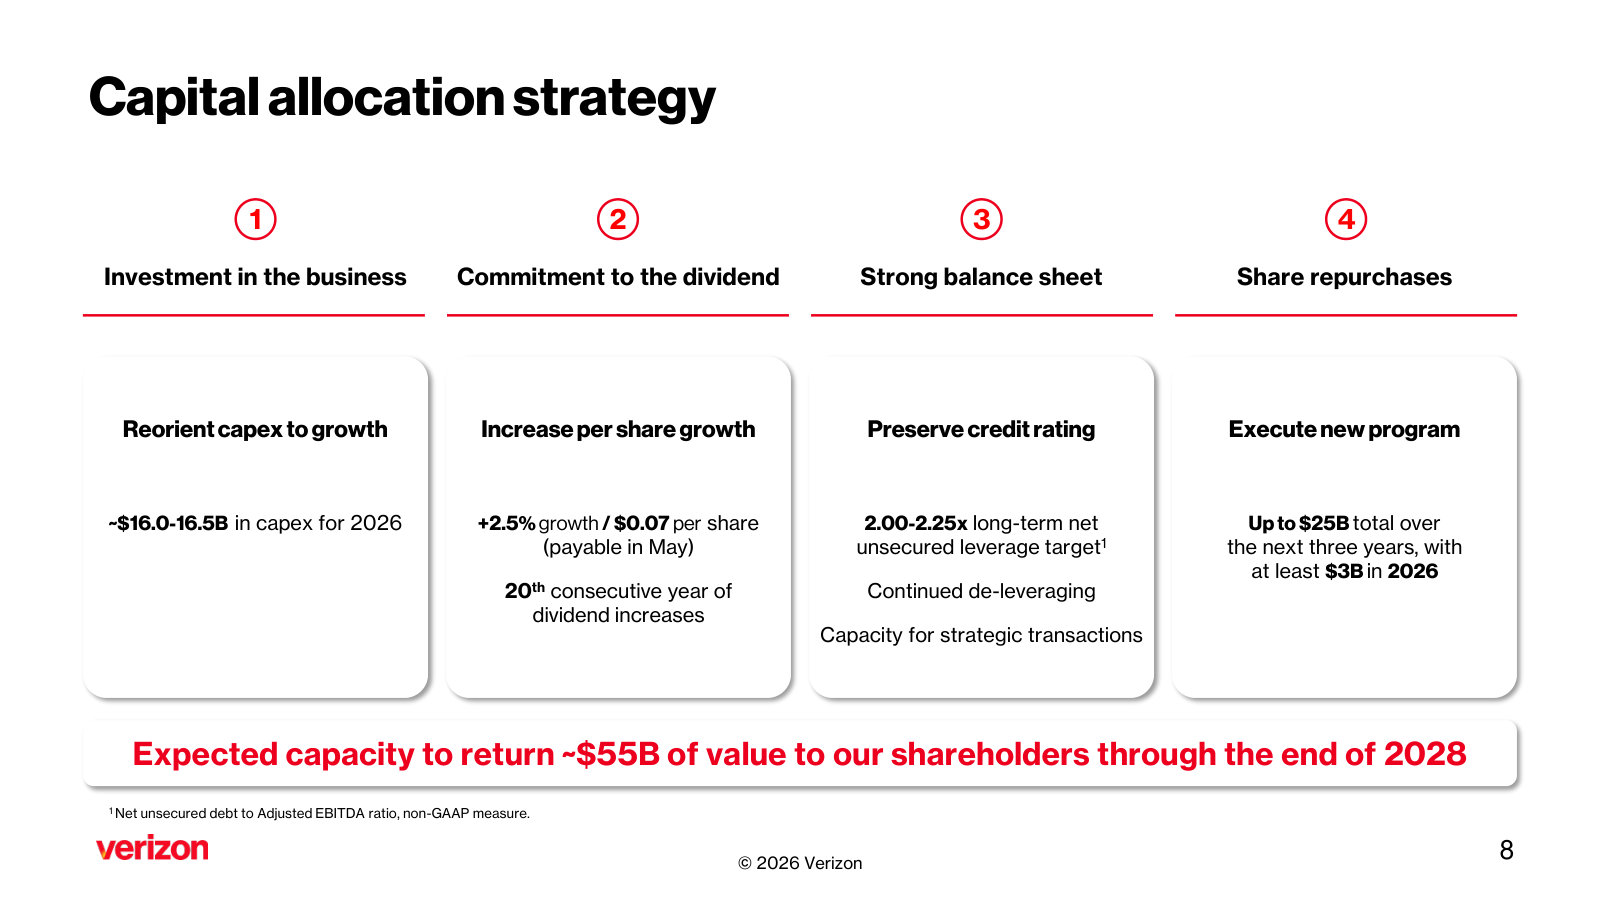
Fourth Quarter 2025 Earnings — Q4 2025
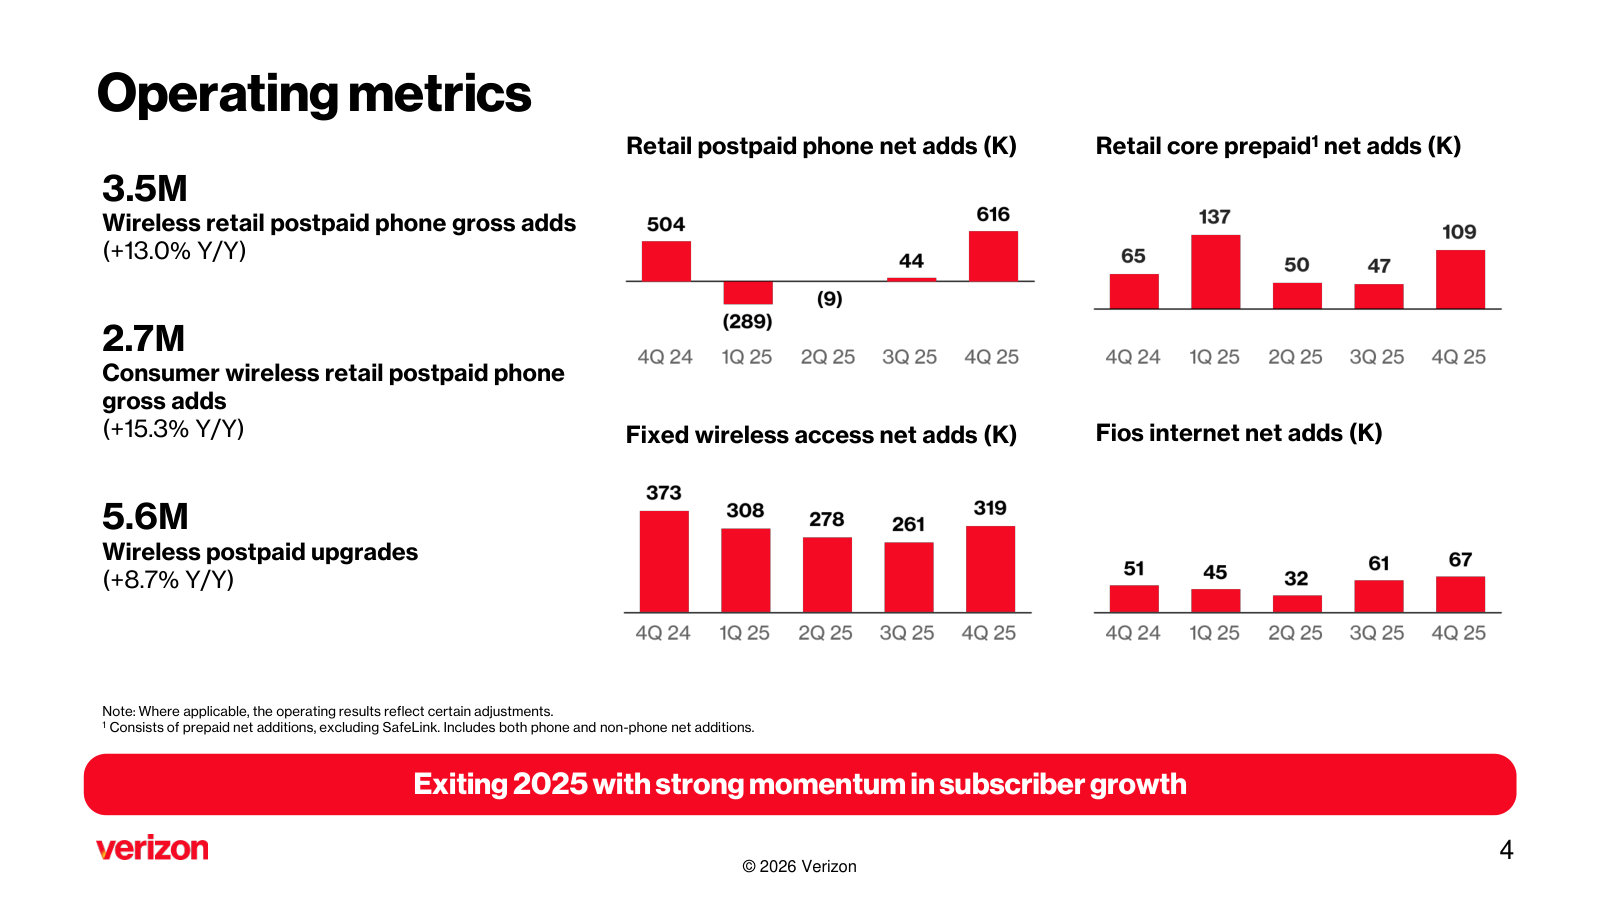
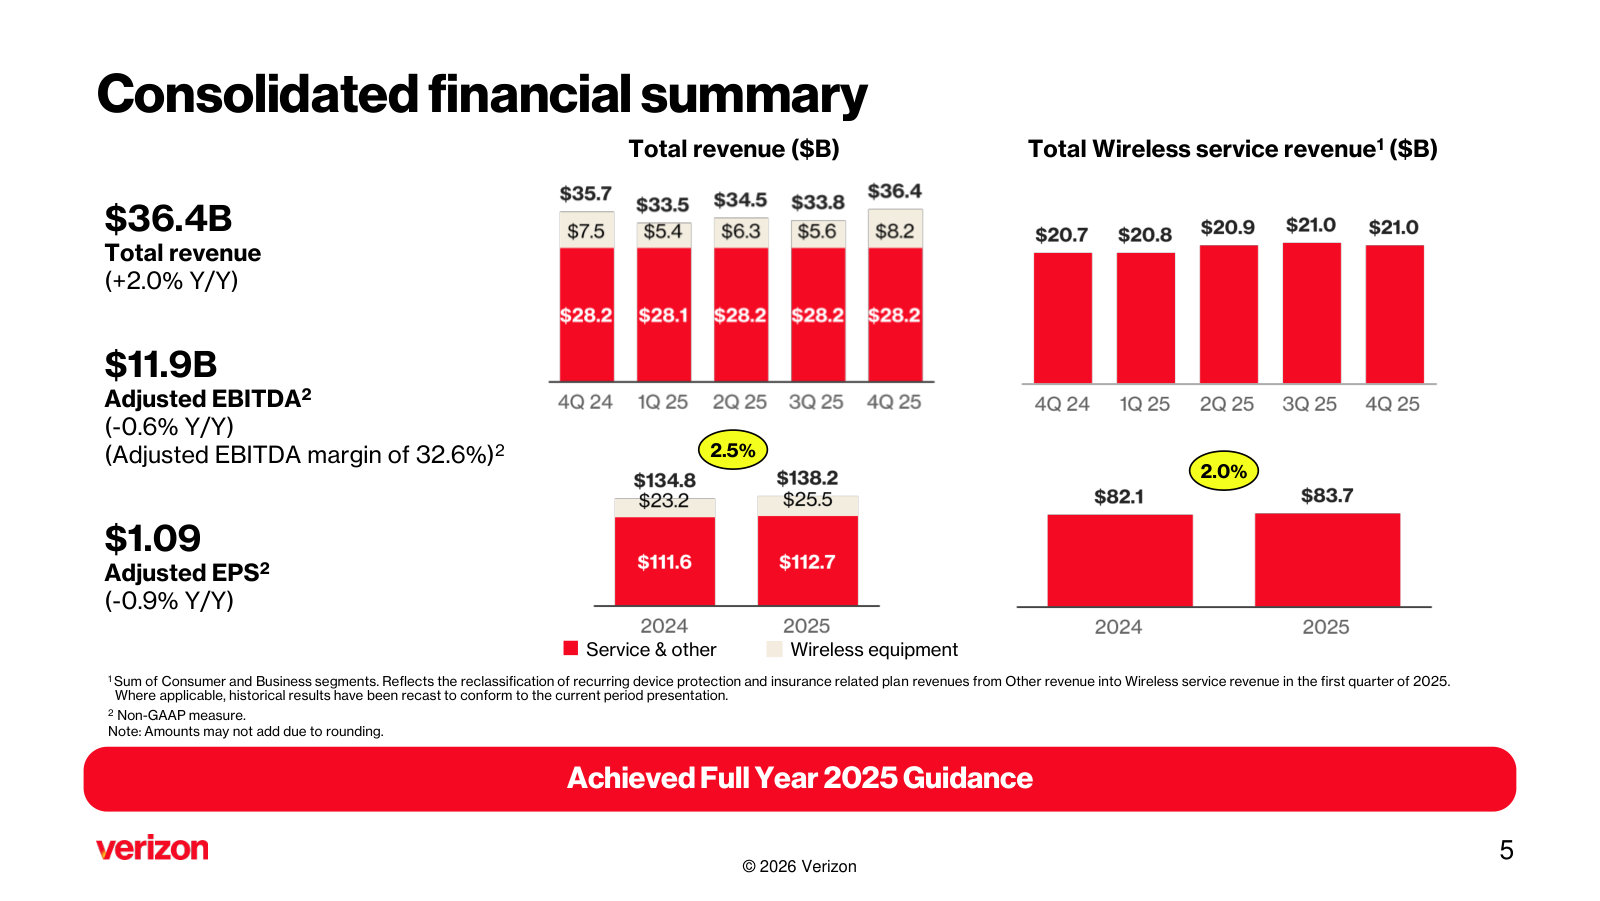
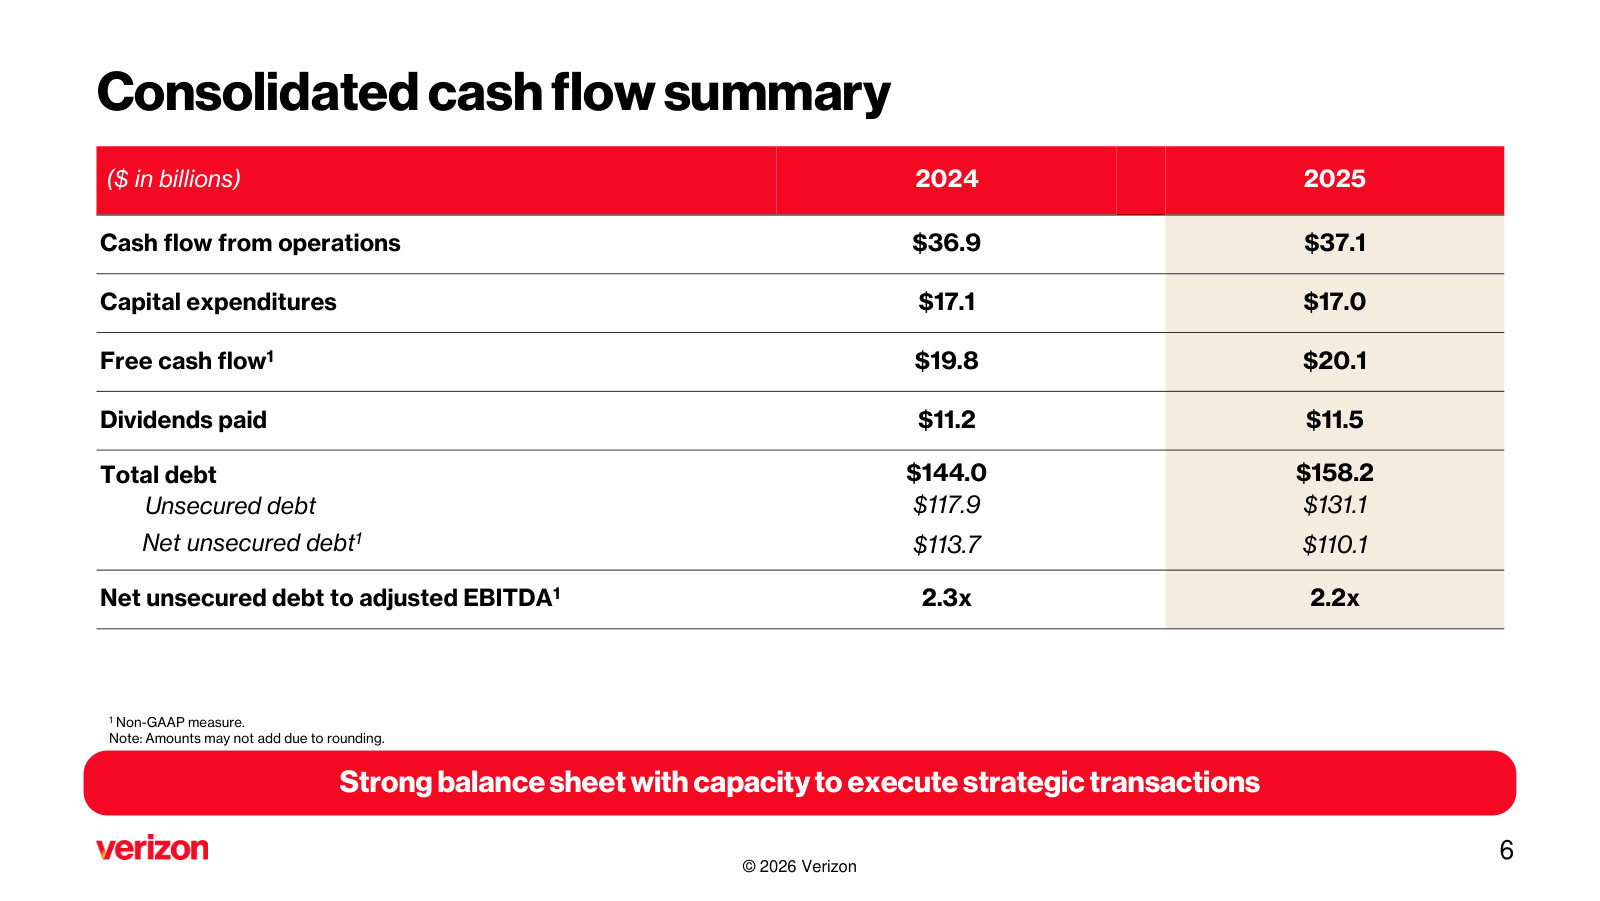
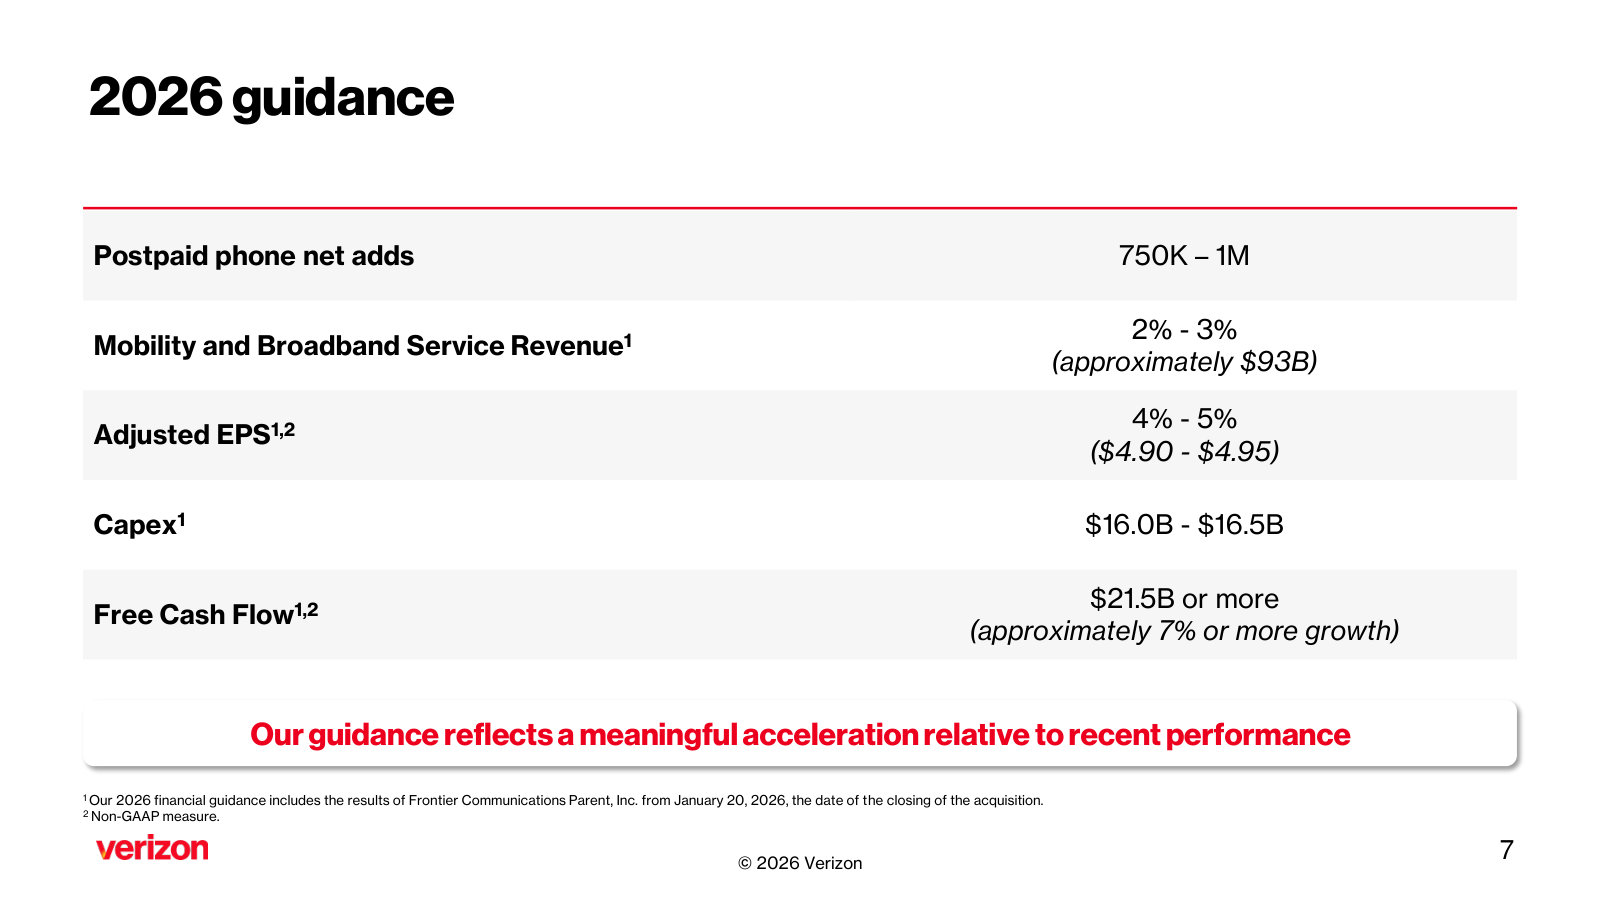
The full-year 2025 wrap and 2026 setup — the clearest single view of revenue composition, capital structure and how management intends to allocate capital. · Open the full document →
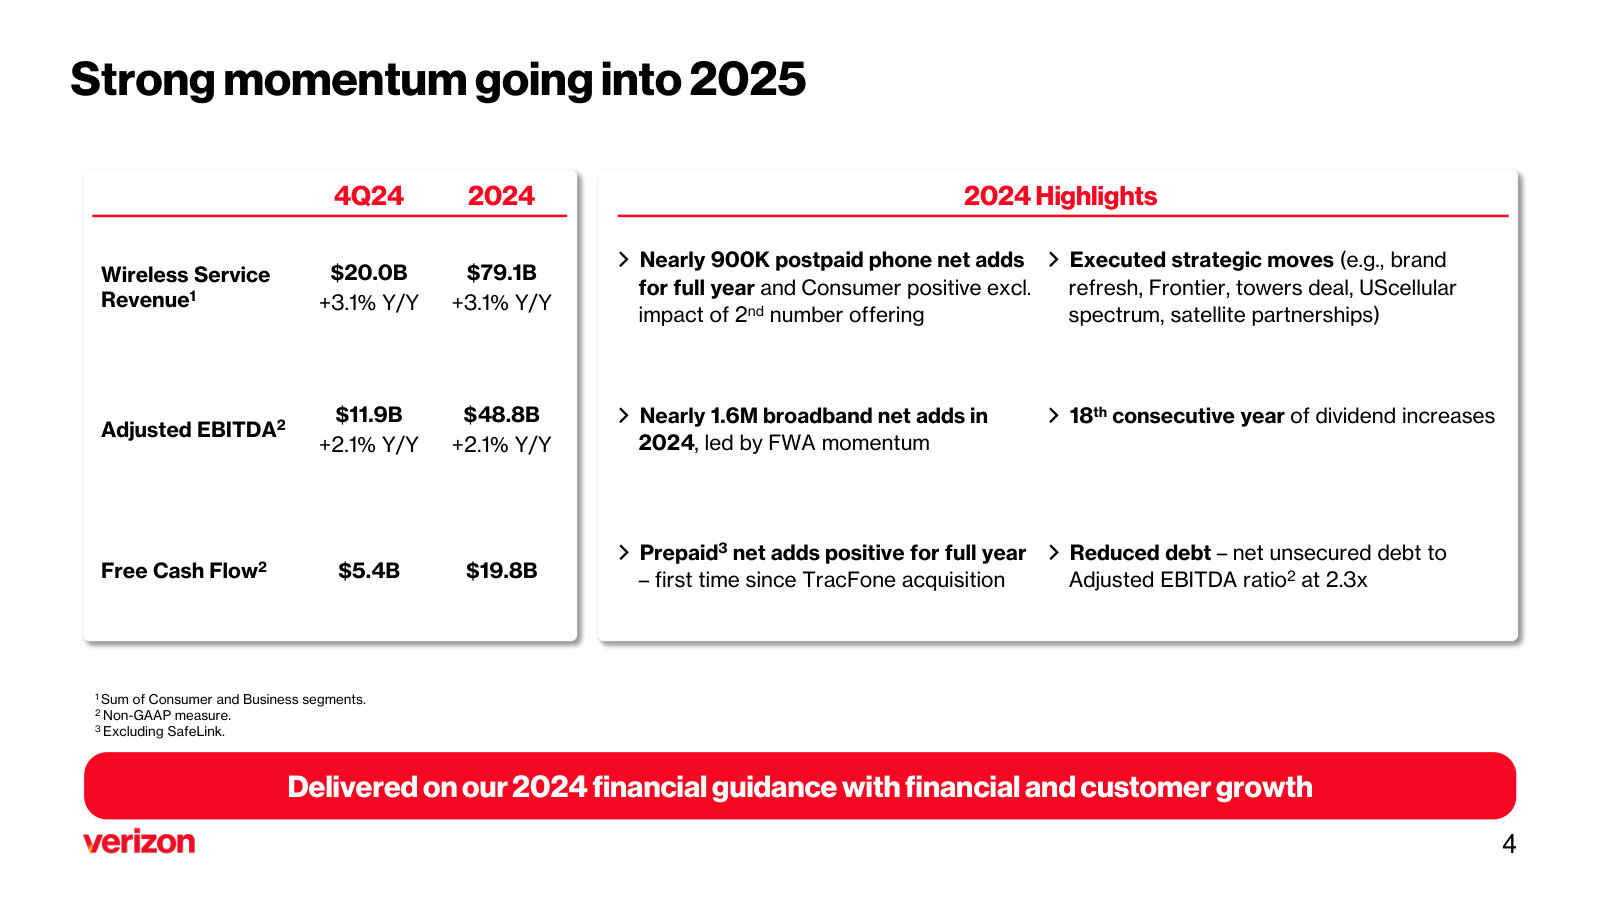
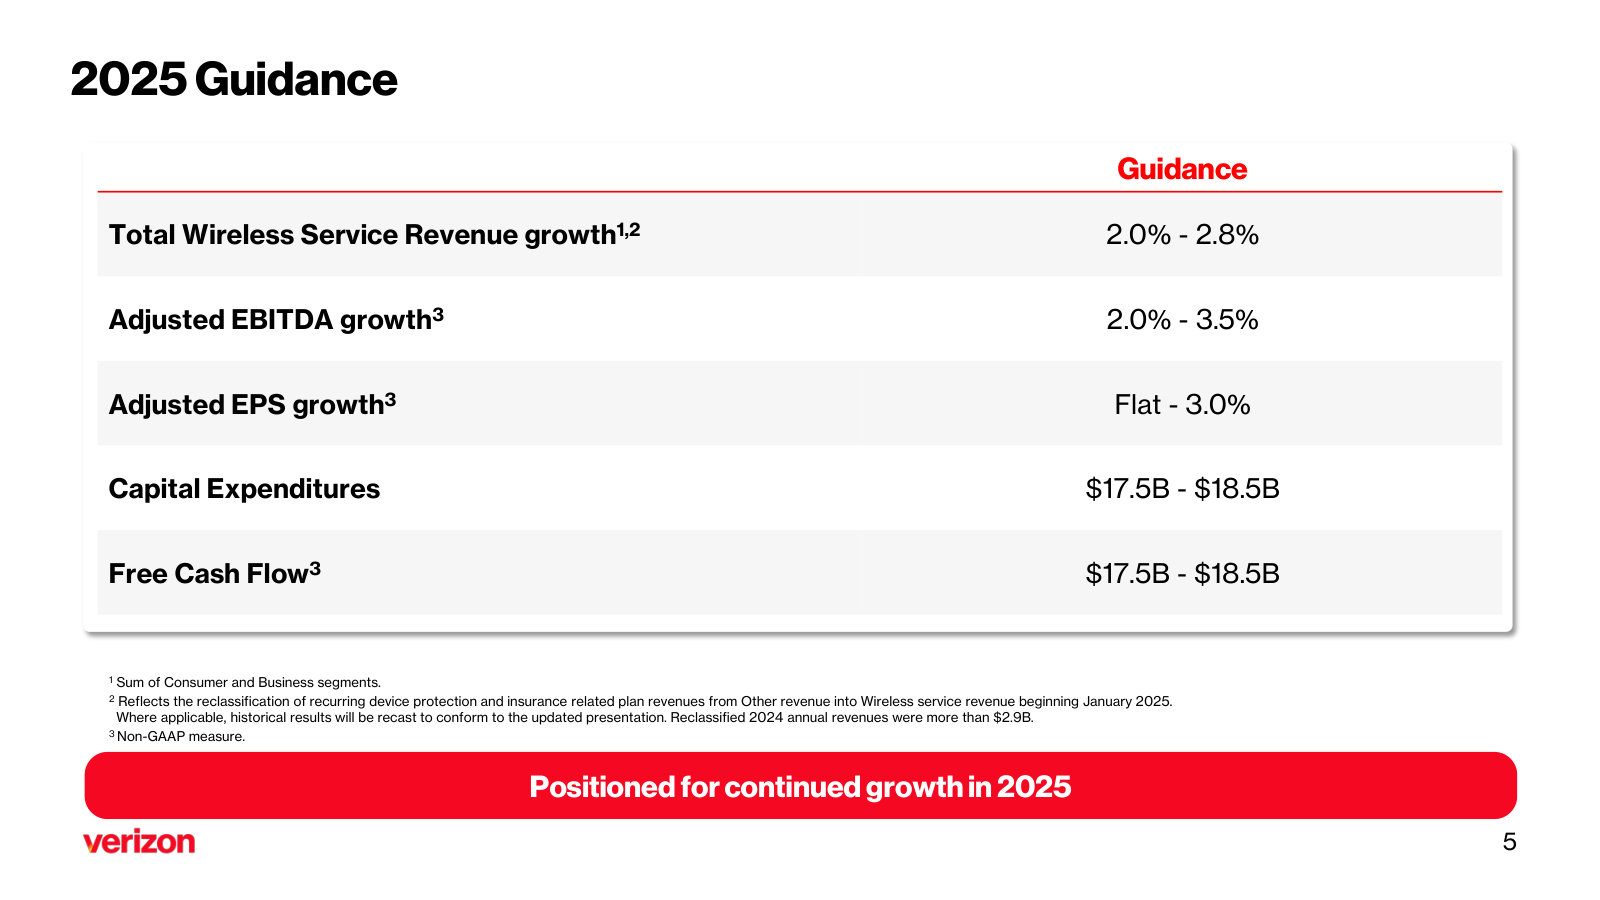
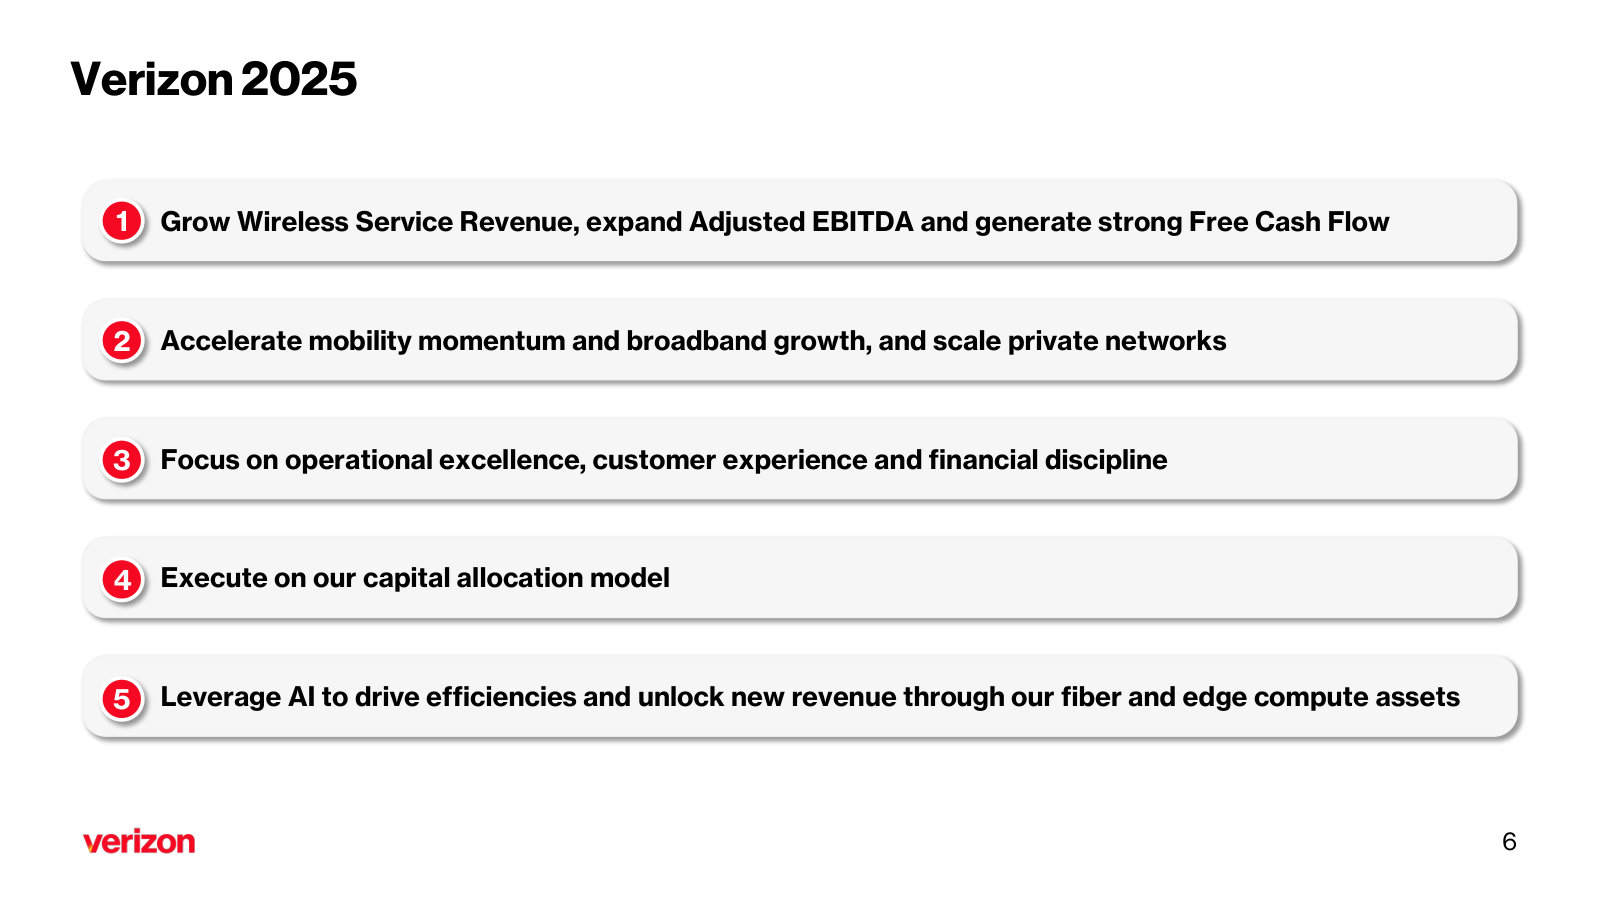
Fourth Quarter 2024 Earnings & Business Update — Q4 2024
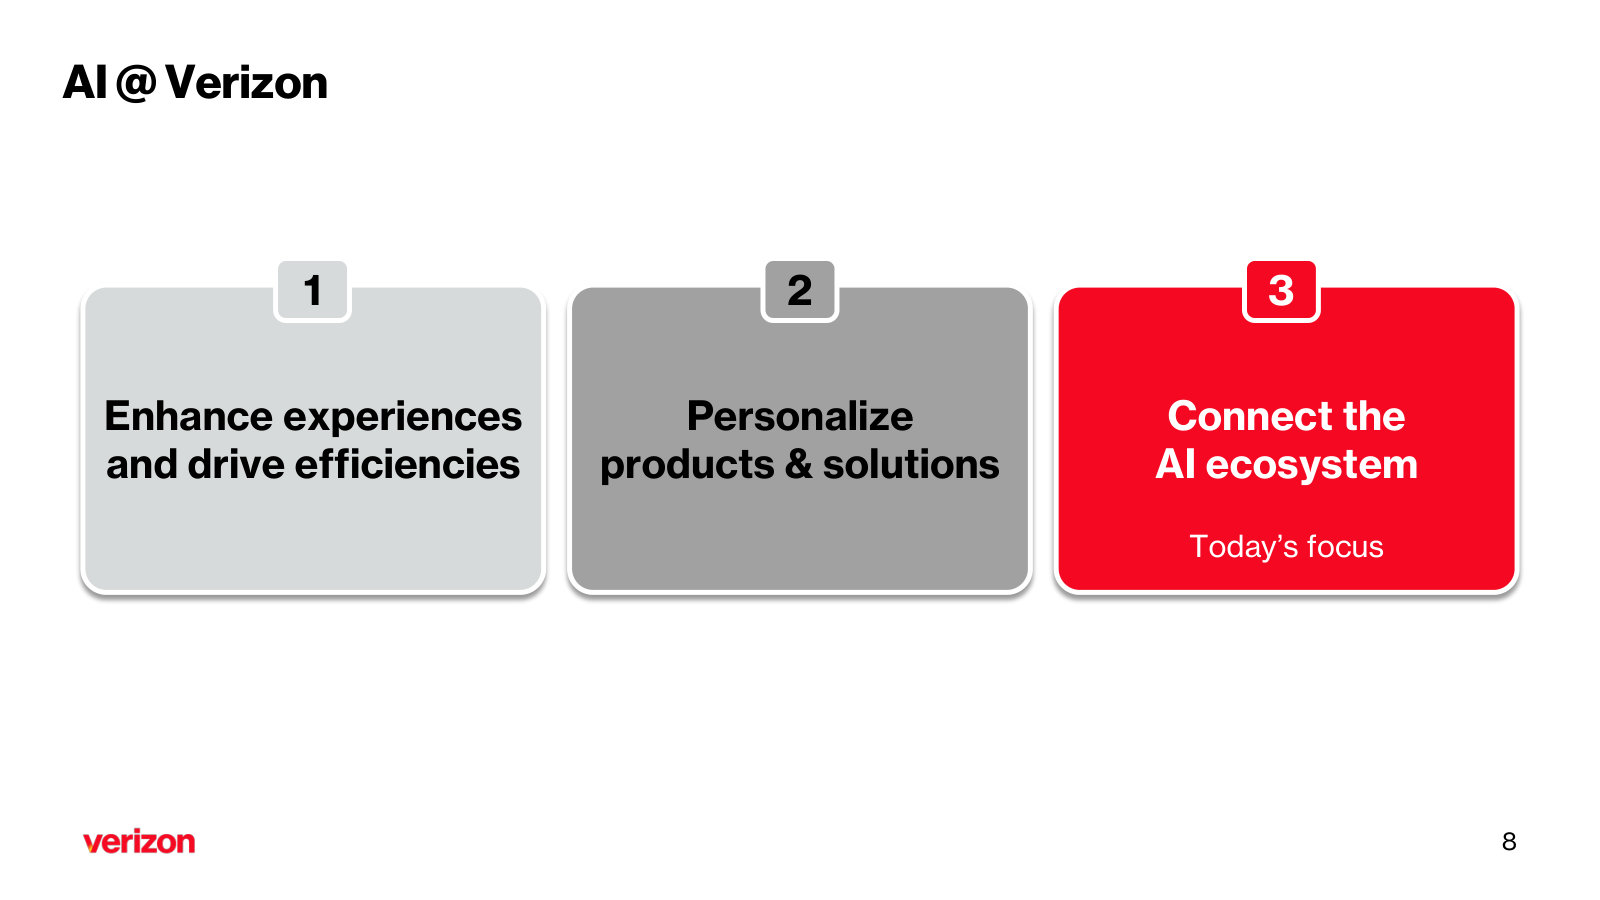
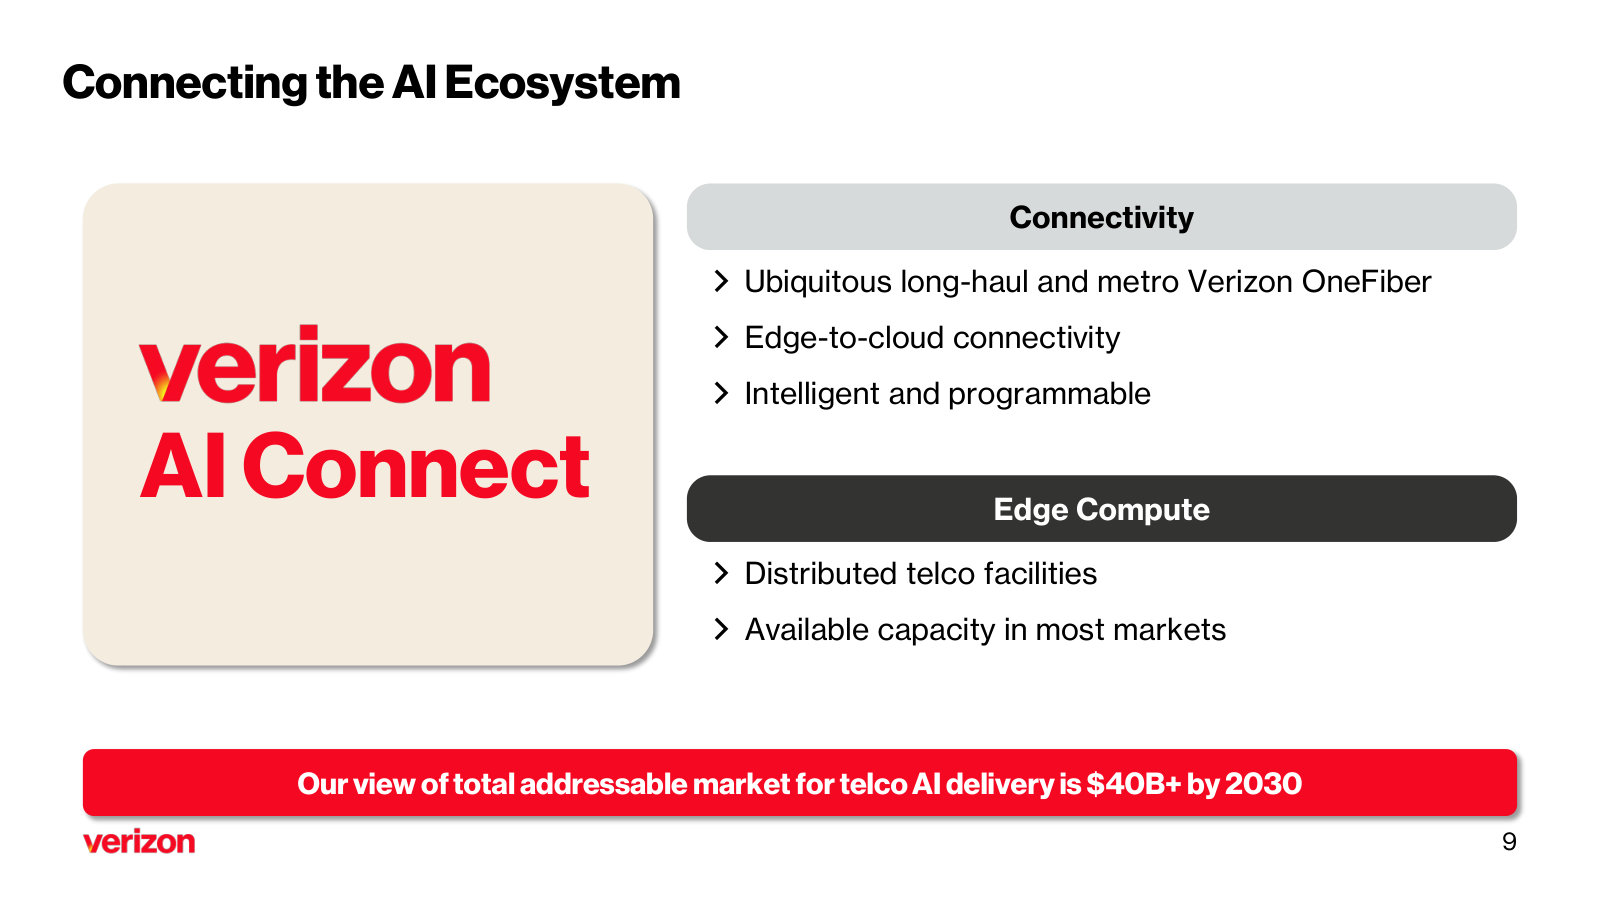
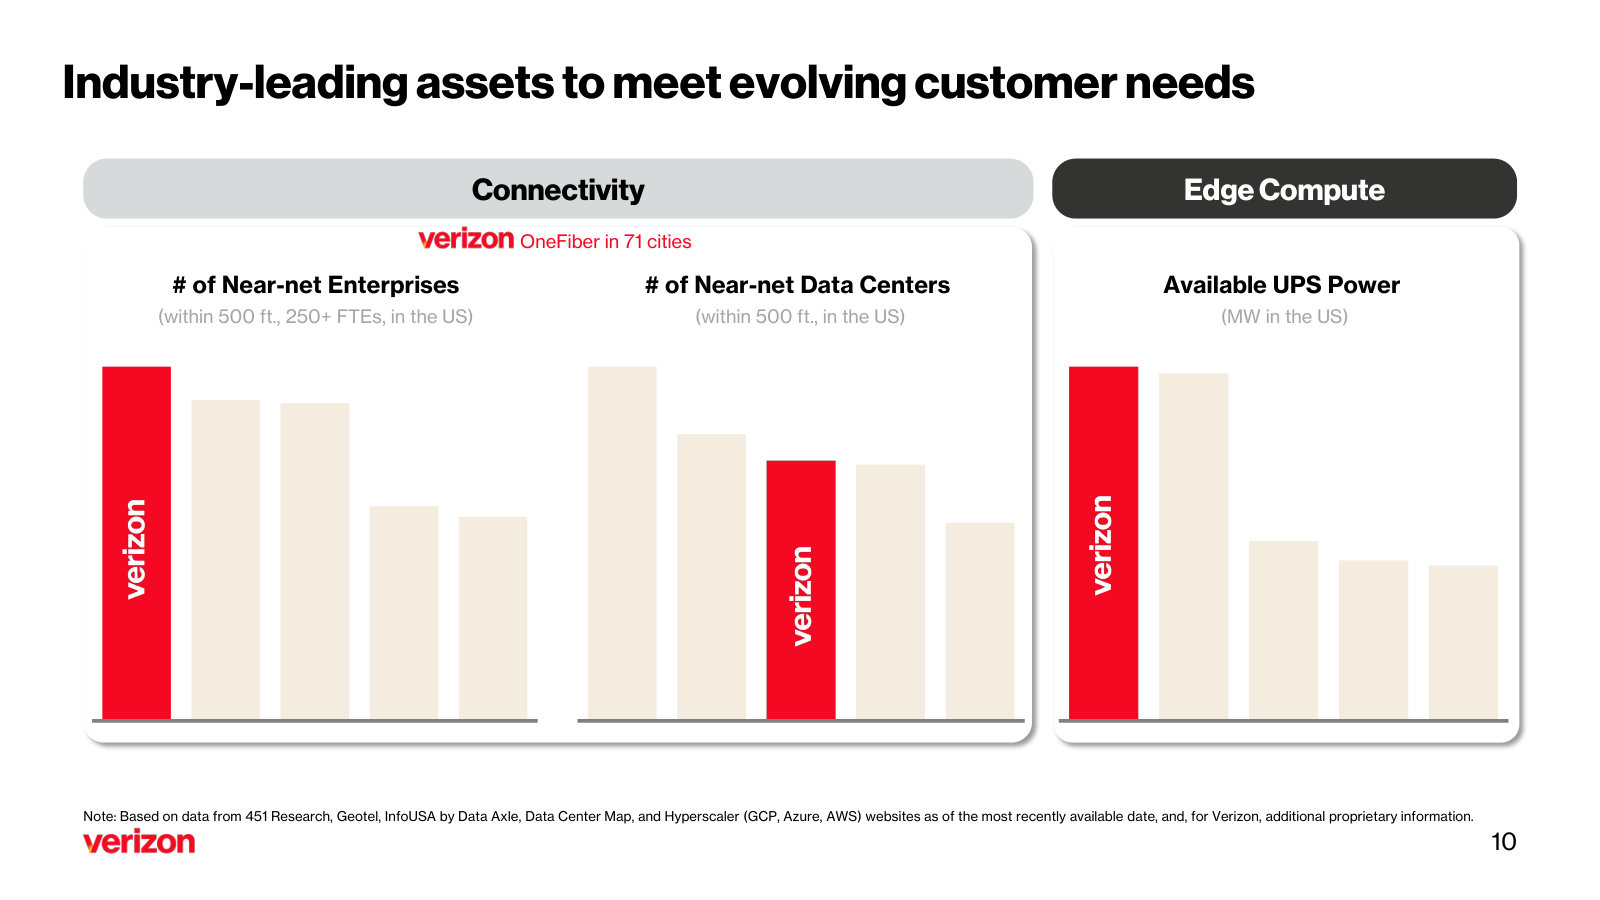
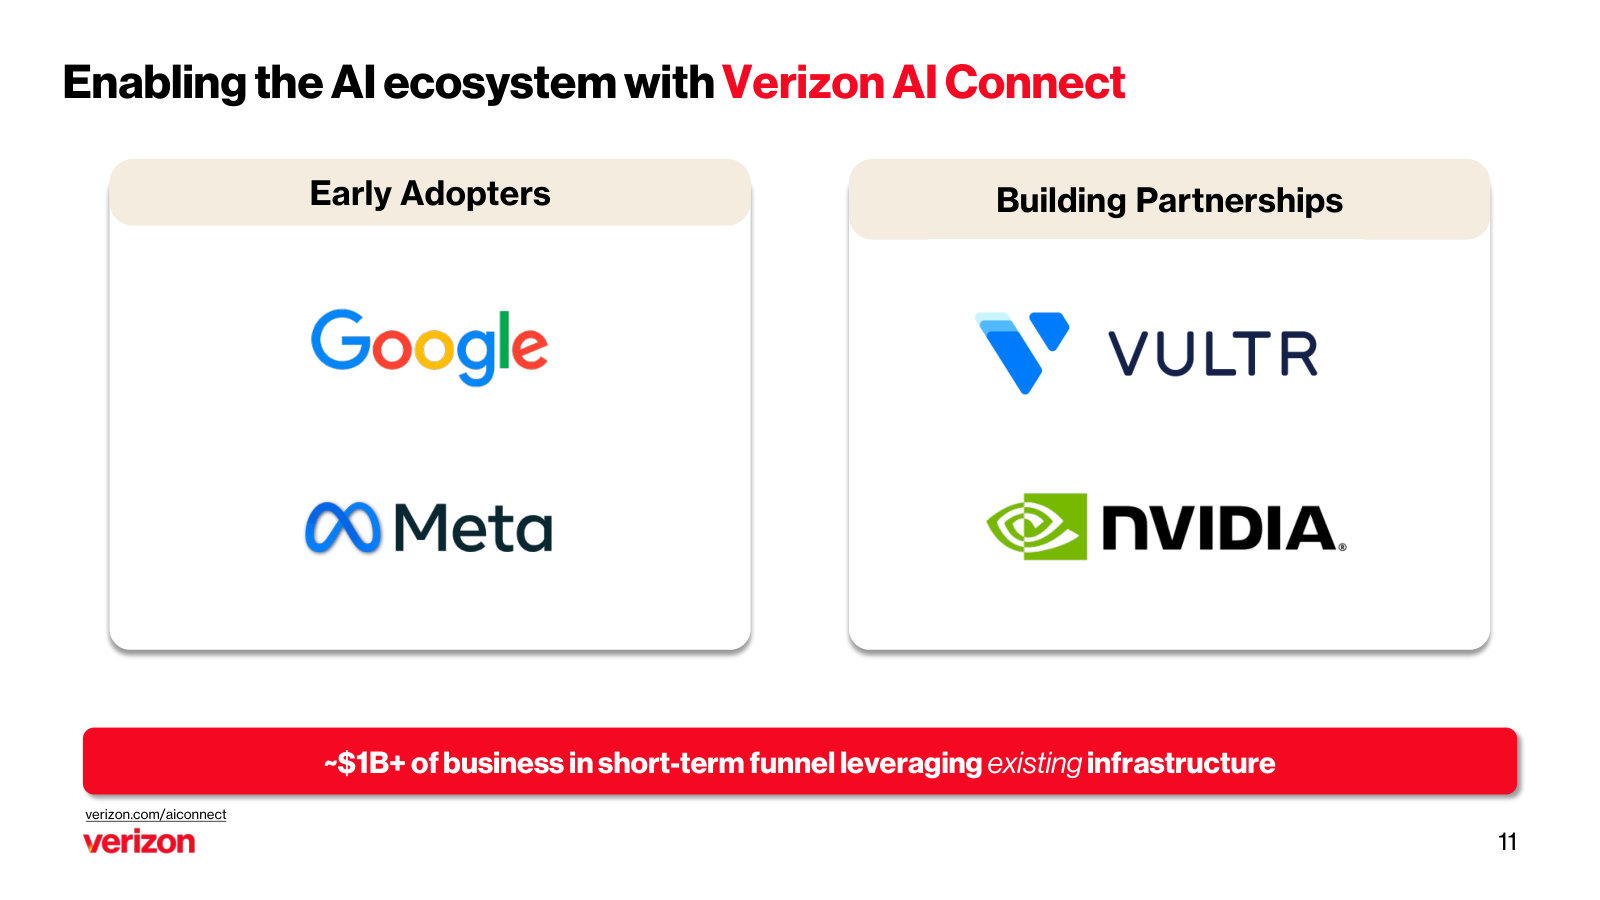
The one deck that goes past the quarter to explain strategy — the 2025 priorities and, in detail, the AI Connect thesis for monetizing fiber and edge assets. · Open the full document →
More from management
First Quarter 2026 Earnings — Q1 2026 · 9 pages · The first full quarter reflecting the closed Frontier acquisition, and the initial 2026 guidance raise. · Open →
First Quarter 2025 Earnings & Business Update — Q1 2025 · 10 pages · A business-update-format deck pairing 1Q25 results with the capital-allocation and strategy framing. · Open →
Fourth Quarter 2023 Earnings — Q4 2023 · 9 pages · The earliest full-year wrap in the set — the 2024 guidance baseline the current trajectory started from. · Open →
Verizon Communications Inc.'s annual reports contain management's most considered account of the business. These are the sections, passages and visual pages worth opening in the originals preserved in Sources.
Verizon Communications Inc. — FY2025 Annual Report (Form 10-K) — FY2025
The latest 10-K, written just after the Frontier close and a reset $55B capital-return plan — the clearest single account of the business today. · Open the full document →
Item 1. Business — p. 5 · Read the full section →
Verizon in its own words: two segments — Consumer (77% of revenue) and Business — and the wireless, fiber and FWA networks that carry them.
The two-segment structure, with each segment's 2025 revenue and share of the consolidated total.
We have two reportable segments that we operate and manage as strategic business units - Verizon Consumer Group (Consumer) and Verizon Business Group (Business). […] In 2025, the Consumer segment’s revenues were $106.8 billion, representing approximately 77% of Verizon’s consolidated revenues. […] In 2025, the Business segment's revenues were $29.1 billion, representing approximately 21% of Verizon’s consolidated revenues.
p. 5 · Read in context →
Item 1A. Risk Factors — p. 19 · Read the full section →
Company-specific risks that could genuinely bite: a heavily unionized workforce and a capital-return pledge management calls not guaranteed.
About 27% of the workforce is unionized (CWA/IBEW); contract renegotiations risk added cost or work stoppages.
As of December 31, 2025, approximately 27% of our workforce is represented by the Communications Workers of America or the International Brotherhood of Electrical Workers. With subsequent negotiations we could incur additional costs and/or experience work stoppages, which could adversely affect our business operations.
p. 25 · Read in context →
The January 2026 pledge to return about $55B through 2028, incl. a $25B buyback — explicitly not guaranteed.
In January 2026, we announced that we believed that our strategic plans would provide us with the capacity to return approximately $55 billion to our shareholders, in the form of dividend payments and share repurchases, through the end of 2028. At that time, the Board of Directors of the Company authorized a share repurchase program of up to $25 billion, as well as a dividend increase, and we stated that we expected to repurchase at least $3 billion of our common stock during 2026.
p. 31 · Read in context →
Item 7. Management's Discussion and Analysis — p. 39 · Read the full section →
Where management explains 2025: two acquisitions reshaped the footprint, and Consumer statistics show where growth came from.
Frontier (fiber, 31 states) and Starry (FWA), both closed January 2026, expand the broadband footprint.
On January 20, 2026, we completed the acquisition of Frontier, a U.S. provider of broadband internet and other communication services. This transaction expanded our fiber broadband footprint to 31 U.S. states and Washington D.C., and provides opportunities for future growth. […] On January 30, 2026, we completed the acquisition of Starry, a fixed wireless broadband provider serving multi-dwelling units in five markets across the U.S. This transaction is expected to provide additional FWA capabilities and enhance our ability to deliver high-speed internet to multi-dwelling units and urban communities.
p. 42 · Read in context →
Critical Accounting Estimates — Wireless Licenses and Goodwill — p. 77 · Read the full section →
Spectrum is the business: $157B of wireless licenses carried as indefinite-lived and never amortized — an annual impairment judgment.
$157.0B of wireless licenses treated as indefinite-lived and tested for impairment rather than amortized.
Wireless licenses and goodwill are a significant component of our consolidated assets. Both our wireless licenses and goodwill are treated as indefinite-lived intangible assets and, therefore are not amortized, but rather are tested for impairment annually in the fourth fiscal quarter, unless there are events requiring an earlier assessment or changes in circumstances during an interim period suggesting impairment indicators are present. We believe our estimates and assumptions are reasonable and represent appropriate marketplace considerations as of the valuation date. Although we use consistent methodologies in developing the assumptions and estimates underlying the fair value calculations used in our impairment tests, these estimates and assumptions are uncertain by nature, may change over time and can vary from actual results. It is possible that in the future there may be changes in our estimates and assumptions, including the timing and amount of future cash flows, margins, growth rates, market participant assumptions, comparable benchmark companies and related multiples and discount rates, which could result in different fair value estimates. Significant and adverse changes to any one or more of the above-noted estimates and assumptions could result in an impairment to our wireless licenses and goodwill impairment for one or more of our reporting units. […] The carrying value of our wireless licenses was approximately $157.0 billion as of December 31, 2025. We aggregate our wireless licenses into one single unit of accounting, as we utilize our wireless licenses on an integrated basis as part of our nationwide wireless network. Our wireless licenses provide us with the exclusive right to utilize certain radio frequency spectrum to provide wireless communication services.
p. 77 · Read in context →
More annual reports
Verizon Communications Inc. — FY2024 Annual Report (Form 10-K) — FY2024 · 198 pages · The year before the Frontier deal and capital-return reset — the prior baseline for footprint, leverage and buyback posture. · Open →
Verizon Communications Inc. — FY2023 Annual Report (Form 10-K) — FY2023 · 198 pages · Peak C-Band build-out and deleveraging phase; useful for tracking capex and FWA ramp from an earlier point. · Open →
Verizon Communications Inc. — FY2022 Annual Report (Form 10-K) — FY2022 · 202 pages · First full year of C-Band 5G deployment and the debt peak that framed the years of capital discipline that followed. · Open →
Verizon Communications Inc. — FY2021 Annual Report (Form 10-K) — FY2021 · 187 pages · The $45B+ C-Band spectrum year that set up the wireless-license balance still central to the business today. · Open →
Source: S&P Capital IQ consensus via Xpressfeed · Generated 2026-07-25.
Verizon's tape is a margin-and-capital-return story, not a growth one: normalized-EPS estimates have been revised up 6% to 15% over the past six months while revenue forecasts sit roughly flat. The company has beaten normalized-EPS consensus every quarter for two years, even as its last two revenue prints came in light. Consensus has EPS compounding well ahead of the ~2% top line, and the street stays hold-heavy with no sells.
Normalized EPS revised up 6-15% over 180 days while revenue holds flat
The upgrade is a margin story, not a demand story: over the last 30 days EPS estimates are essentially flat, so the bulk of the move landed earlier and has since stabilized.
Currency: USD · Scale: money in millions, absolute · Point-in-time consensus; Δ90d is Now versus 90d.
| Metric | FY | 180d | 90d | 30d | Now | Δ90d |
|---|---|---|---|---|---|---|
| EPS (normalized) | FY2027 | $4.95 | $5.25 | $5.27 | $5.25 | +0.0% |
| EPS (normalized) | FY2028 | $4.99 | $5.83 | $5.77 | $5.76 | -1.2% |
| Revenue | FY2027 | $141.74bn | $146.18bn | $144.74bn | $144.24bn | -1.3% |
| Revenue | FY2028 | $146.66bn | $147.64bn | $147.04bn | $146.73bn | -0.6% |
Eight straight normalized-EPS beats, but the last two revenue prints missed
Every normalized-EPS surprise on record is positive, mostly in the low-single-digit range that reads as sandbagged guidance. Revenue, by contrast, has slipped below consensus in the two most recent quarters.
Current sequences by metric: Revenue: 2 consecutive misses; EPS (normalized): 8 consecutive beats.
Currency: USD · Scale: money in millions, absolute · Consensus is captured before each actual first became effective.
| Quarter | Metric | Consensus | Actual | Surprise | Outcome |
|---|---|---|---|---|---|
| Q2 FY2026 | Revenue | $35.11bn | $34.25bn | -2.4% | Miss |
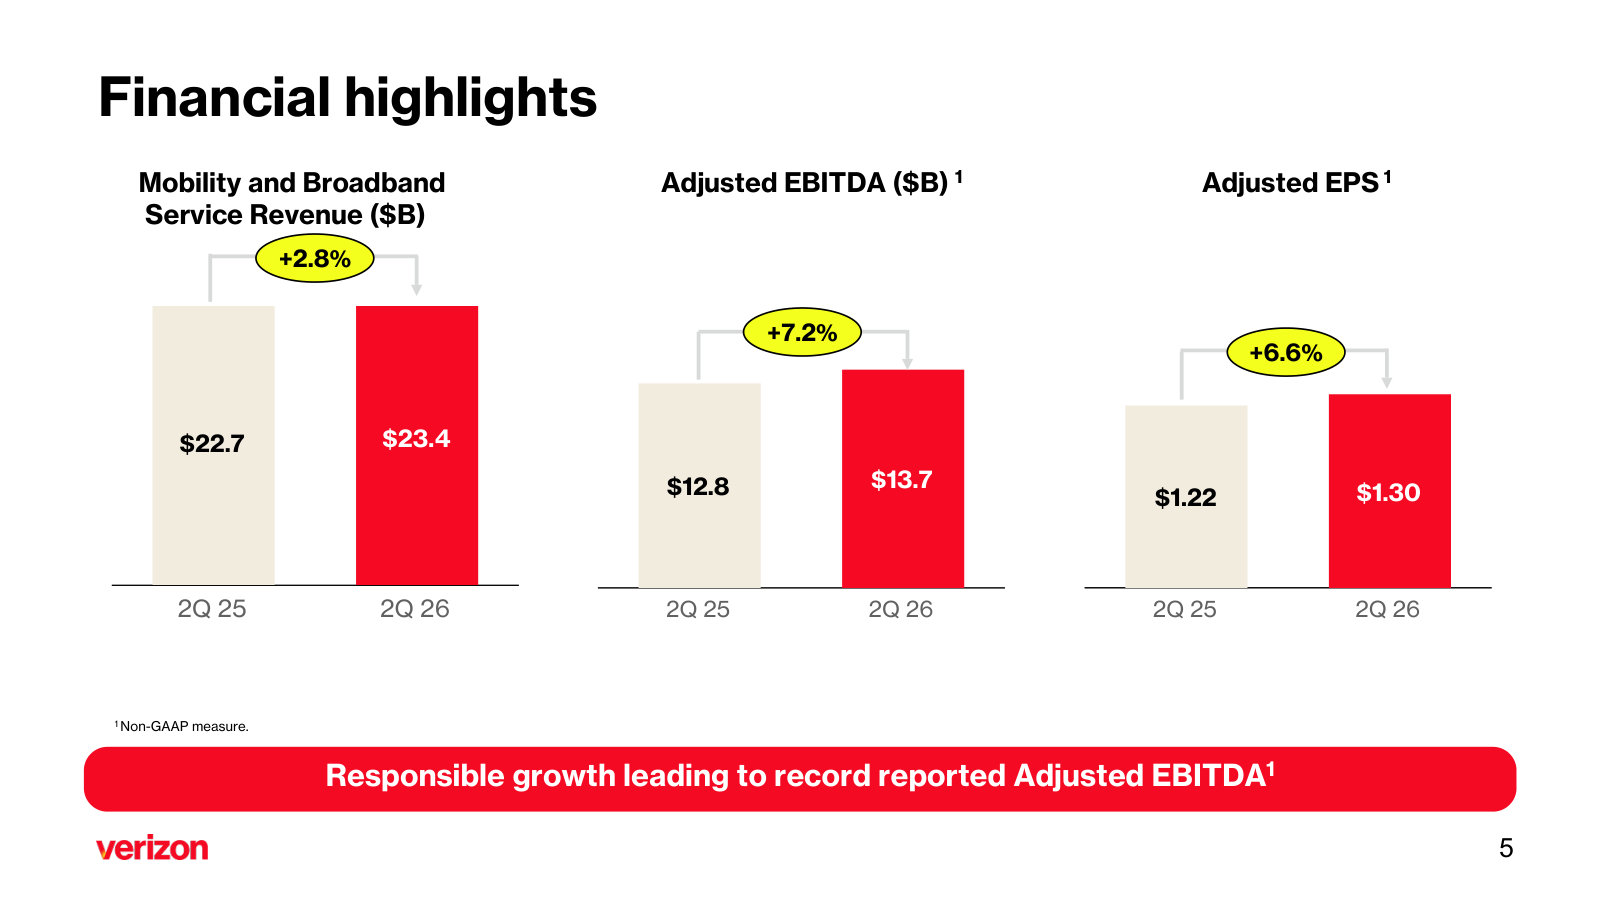
| Q2 FY2026 | EPS (normalized) | $1.27 | $1.30 | +2.7% | Beat |
| Q1 FY2026 | Revenue | $34.89bn | $34.44bn | -1.3% | Miss |
| Q1 FY2026 | EPS (normalized) | $1.21 | $1.28 | +5.8% | Beat |
| Q4 FY2025 | Revenue | $36.20bn | $36.38bn | +0.5% | Beat |
| Q4 FY2025 | EPS (normalized) | $1.06 | $1.09 | +3.3% | Beat |
| Q3 FY2025 | Revenue | $34.27bn | $33.82bn | -1.3% | Miss |
| Q3 FY2025 | EPS (normalized) | $1.19 | $1.21 | +1.5% | Beat |
| Q2 FY2025 | Revenue | $33.71bn | $34.50bn | +2.4% | Beat |
| Q2 FY2025 | EPS (normalized) | $1.19 | $1.22 | +2.6% | Beat |
| Q1 FY2025 | Revenue | $33.28bn | $33.48bn | +0.6% | Beat |
| Q1 FY2025 | EPS (normalized) | $1.15 | $1.19 | +3.7% | Beat |
| Q4 FY2024 | Revenue | $35.33bn | $35.68bn | +1.0% | Beat |
| Q4 FY2024 | EPS (normalized) | $1.10 | $1.10 | +0.3% | Beat |
| Q3 FY2024 | Revenue | $33.42bn | $33.33bn | -0.3% | Miss |
| Q3 FY2024 | EPS (normalized) | $1.18 | $1.19 | +0.7% | Beat |
Consensus has EPS compounding toward ~13% by FY29 on ~2% revenue growth
Revenue is modeled at low-single-digit growth throughout, while normalized EPS accelerates each year, widening the gap between top-line and per-share growth.
Currency: USD · Scale: money in millions, absolute · YoY uses the prior fiscal year from the feed; analyst count and range use the first displayed period.
| Metric | FY2026E | FY2027E | FY2028E | FY2029E | YoY | Analysts | Low / high |
|---|---|---|---|---|---|---|---|
| Revenue | $141.78bn | $144.22bn | $146.66bn | $150.15bn | +2.6% | 19 | $139.55bn / $143.09bn |
| EBITDA | $53.59bn | $54.85bn | $56.31bn | $58.66bn | +7.2% | 17 | $52.85bn / $54.04bn |
| EPS (normalized) | $5.00 | $5.26 | $5.78 | $6.55 | +6.1% | 15 | $4.97 / $5.04 |
FY29 normalized EPS spans $5.60-$7.07 on just four analysts
Coverage thins fast past FY27 - FY29 rests on only four EPS estimates, so treat that year's mean as indicative rather than a firm consensus. The FY28 spread is set by 15 analysts and reflects real disagreement, not just sparse data.
Currency: USD · Scale: money in millions, absolute · Spread/mean is absolute high-low divided by absolute mean.
| Metric | Period | Mean | Low–high | Spread/mean | Analysts |
|---|---|---|---|---|---|
| EPS (normalized) | FY2029E | $6.55 | $5.60–$7.07 | 22.4% | 4 |
| Revenue | FY2029E | $150.15bn | $143.78bn–$153.36bn | 6.4% | 4 |
| EPS (normalized) | FY2028E | $5.78 | $5.33–$6.19 | 14.9% | 15 |
Street sits hold-heavy: 15 holds, no sells, targets $43-71
Currency: USD · Scale: money in millions, absolute · Analyst counts shown explicitly.
| Street view | Reading | Analysts |
|---|---|---|
| Recommendation mix | Buy 8, Outperform 3, Hold 15, Underperform 0, Sell 0 | 26 |
| Consensus score | 2.27 | 26 |
| Target price | mean $50.95; median $51.00; high $71.00; low $43.00 | 23 |
Visible Alpha broker models via S&P Xpressfeed · 19 brokers · 677 line items · freshest revision 2026-07-24.
Verizon's broker models frame a wireless-and-broadband convergence story: fixed-wireless and fiber drive connections growth while wireless service revenue and Consumer EBITDA compound modestly. Margins widen — EBITDA margin toward ~39% — and free cash flow climbs from roughly $20B to ~$25B, steadily covering a low-single-digit dividend. Headline revenue and EPS consensus is tight and well-covered (see the CapIQ tab); the differentiated debate lives in the operating KPIs below, where forward-year coverage is thin.
Forward KPI detail rests on a handful of brokers
FY-2025 columns reflect 15-19 broker models of a just-reported year; the FY-2026 to FY-2028 net-add, FWA and segment-EBITDA lines below are carried by only 2-6 brokers, and a few (FWA ARPU forward, Consumer postpaid net adds FY-2028, Frontier revenue) rest on a single broker. Treat the forward KPI dispersion as thin, not settled.
Fixed-wireless is the broadband engine, but net-add momentum rolls over
Models keep scaling the FWA base but taper annual net adds year after year as the addressable, already-passed footprint matures. ARPU is modeled essentially flat near $48.
| Line | FY-2025A | FY-2026E | FY-2027E | FY-2028E | YoY | Brokers |
|---|---|---|---|---|---|---|
| Subscribers | — | — | — | — | — | — |
| Ending subscribers - Fixed wireless access (FWA) broadband(K#) | 5.67m Number | 6.67m Number | 7.52m Number | 8.28m Number | +17.6% | 14 |
| Average subs - Fixed wireless access (FWA) broadband(K#) | 5.11m Number | 6.20m Number | 7.09m Number | 7.79m Number | +21.3% | 14 |
| Net adds | — | — | — | — | — | — |
| Net adds- Fixed wireless access (FWA) broadband(K#) | 1.08m Number | 944,580 Number | 843,776 Number | 705,045 Number | -12.3% | 14 |
| Unit economics | — | — | — | — | — | — |
| ARPU - Fixed wireless access (FWA) broadband($) | $47.90 | $47.94 | $48.42 | $48.90 | +0.1% | 8 |
Key drivers
| Line | FY-2025A | FY-2026E | FY-2027E | FY-2028E | YoY | Brokers |
|---|---|---|---|---|---|---|
| Net adds - Wireless retail postpaid phones(K#) | 158,640 Number | 813,053 Number | 1.06m Number | 1.06m Number | +412.5% | 14 |
| Net adds - Wireless Retail postpaid phone - Consumer(K#) | -25,266 Number | 554,801 Number | 690,636 Number | 744,832 Number | +2295.8% | 14 |
| Net Adds - Wireless Retail postpaid phones - Business(K#) | 193,967 Number | 319,332 Number | 329,795 Number | 355,803 Number | +64.6% | 13 |
Key drivers
| Line | FY-2025A | FY-2026E | FY-2027E | FY-2028E | YoY | Brokers |
|---|---|---|---|---|---|---|
| Fiber broadband subscribers(K#) | 7.92m Number | 11.26m Number | 11.89m Number | 12.40m Number | +42.1% | 16 |
| Net adds - Fiber broadband(K#) | 192,484 Number | 3.40m Number | 695,035 Number | 664,346 Number | +1664.0% | 16 |
| Internal/organic Net adds - Fiber broadband(K#) | — | 589,000 Number | 604,250 Number | 565,000 Number | — | 10 |
Key drivers
EBITDA and FCF margins expand while capex/sales drifts to ~11.6%, pushing free cash flow higher and the dividend payout ratio down even as the dividend keeps rising.
| Line | FY-2025A | FY-2026E | FY-2027E | FY-2028E | YoY | Brokers |
|---|---|---|---|---|---|---|
| Margins | — | — | — | — | — | — |
| EBITDA margin(%) | 36.4% | 38.1% | 38.3% | 38.7% | +1.8pt | 19 |
| FCF margin(%) | 14.7% | 16.0% | 16.3% | 17.1% | +1.3pt | 15 |
| Cash flow | — | — | — | — | — | — |
| Free cash flow | $20.33bn | $22.50bn | $23.44bn | $24.88bn | +10.7% | 15 |
| Free cash flow per share($) | $4.81 | $5.41 | $5.72 | $6.36 | +12.4% | 14 |
| CapEx / Sales(%) | 12.8% | 11.6% | 11.5% | 11.5% | -1.2pt | 15 |
| Returns | — | — | — | — | — | — |
| Dividends declared per common share($) | $2.73 | $2.83 | $2.90 | $2.95 | +3.5% | 18 |
| Dividend payout ratio(%) | 58.4% | 56.5% | 55.0% | 51.7% | -2.0pt | 17 |
The forward debate is how fast the growth KPIs decelerate
Brokers converge on the P&L headline but split on the pace of FWA and fiber additions and the durability of the postpaid rebound — each row rests on few models.
| Line | Period | Median | Q1–Q3 | Min–max | Brokers |
|---|---|---|---|---|---|
| Net adds- Fixed wireless access (FWA) broadband(K#) | FY-2028E | 760,000 Number | 657,568 Number–780,000 Number | 555,135 Number–800,000 Number | 3 |
| Net adds - Wireless retail postpaid phones(K#) | FY-2028E | 1.05m Number | 957,750 Number–1.15m Number | 831,000 Number–1.31m Number | 4 |
| Net adds - Fiber broadband(K#) | FY-2027E | 683,481 Number | 608,750 Number–765,741 Number | 516,000 Number–910,250 Number | 6 |
Headline P&L consensus, momentum and beat/miss live in the CapIQ tab.
Source: S&P Capital IQ transcripts via Xpressfeed · latest indexed call 2026-07-24 · generated 2026-07-25.
Latest call digest
Verizon Communications Inc., Q2 2026 Earnings Call, Jul 24, 2026 · 2026-07-24T12:30:00
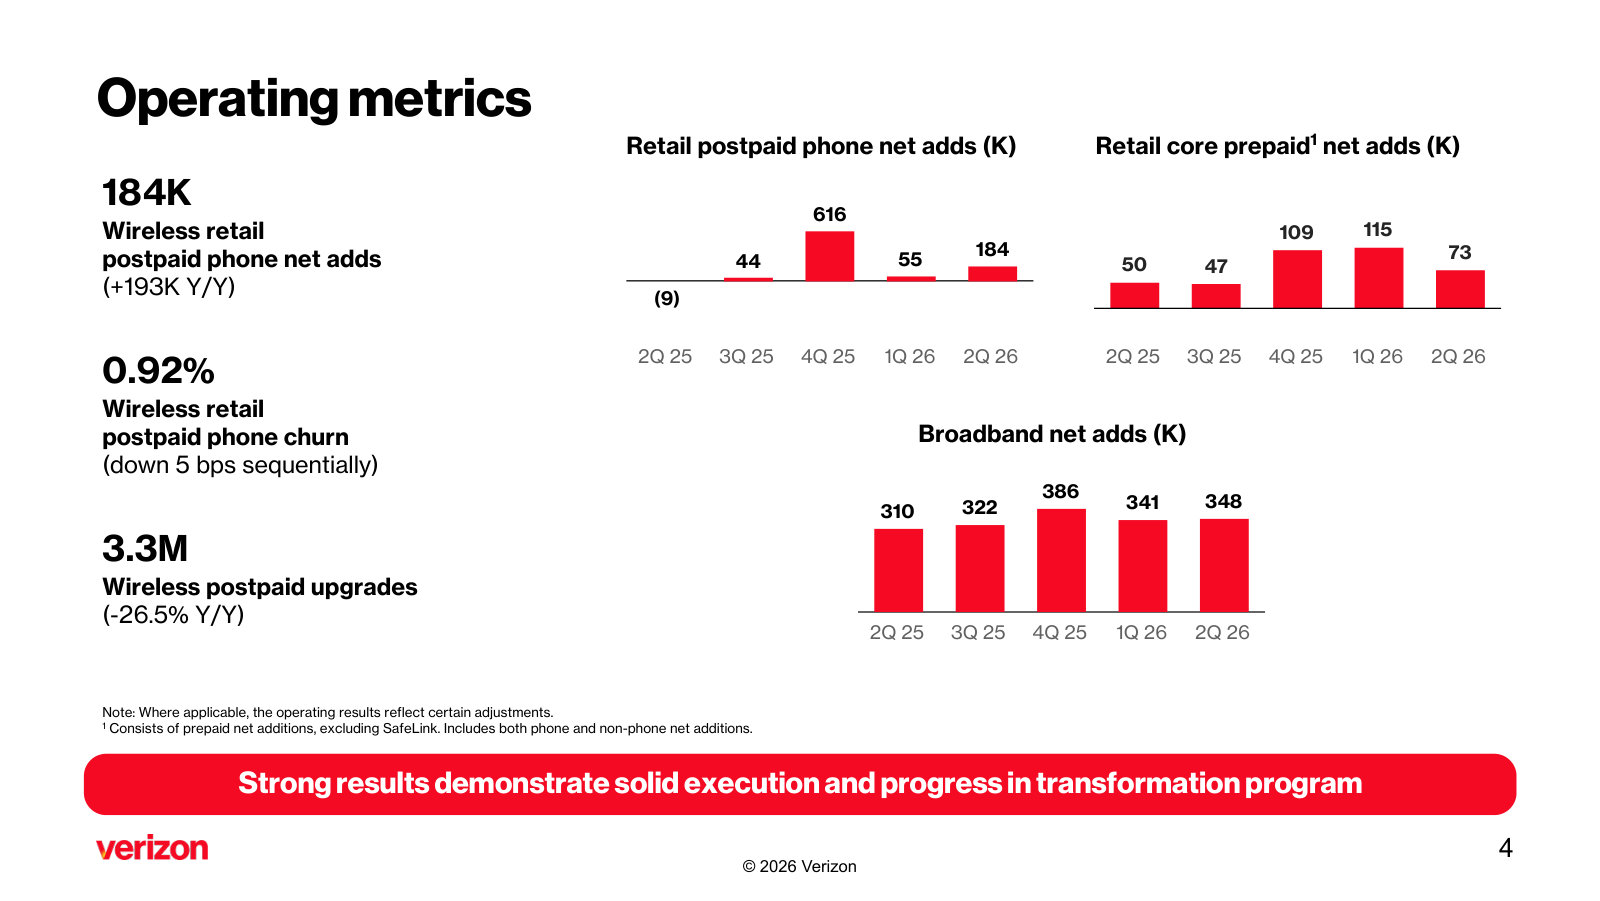
Q2 2026 (reported July 24, 2026) was the third quarter under CEO Dan Schulman and the most emphatic of the reset so far. Prepared remarks framed a 'structural and meaningful inflection': 184,000 postpaid phone net adds, consumer postpaid phone churn down to 84 basis points (a second consecutive sequential decline), mobility and broadband service revenue up 2.8%, adjusted EPS of $1.30 (up 6.6%) and free cash flow of $6.4 billion (up 24%). Management raised full-year guidance for mobility and broadband service revenue (to 2.5%-3%), adjusted EPS (to 6%-7%), free cash flow (to 9%-10% growth) and buybacks (to up to $4.5 billion) — the second straight quarter of raising components of the original guide. Three new items dominated: a mid-June consumer value proposition (Simplicity at $45, converged Verizon One at $70, and an all-customer loyalty program), a 50-50 international-wireline joint venture with BT Group, and a Google dark-fiber deal valued at over $1 billion positioned as the leading edge of an AI-infrastructure ('AI Connect') growth vector expected to contribute from 2027. The board also extended Schulman's contract through December 31, 2028.
The Q&A was narrower than prior calls — only four analysts — and largely tested durability rather than direction. Questioners probed which parts of the new go-to-market are resonating and with which cohorts, how service revenue is replaced as customer pain points (and their fees) are removed, the economics and capital needs of the hyperscale fiber opportunity, the softening fixed-wireless add trend and LEO-satellite competition, and whether the roughly 4% Q4 revenue growth rate is a fair starting point for 2027. Management stayed on message and deferred any formal 2027 guidance to the Q4 call.
Participant coverage from the latest call.
| Group | Participants | Count |
|---|---|---|
| Management | Operator; Colleen Ostrowski — Senior Vice President of Investor Relations, Verizon Communications Inc.; Daniel Schulman — Director & CEO, Verizon Communications Inc.; Anthony Skiadas — Executive VP & CFO, Verizon Communications Inc. | 4 |
| Analysts | Sean Diffley — Equity Analyst, Morgan Stanley, Research Division; Michael Rollins — MD & U.S. Telecoms Analyst, Citigroup Inc., Research Division; John Hodulik — MD, Sector Head of the United States Communications Group and Telco & Pay TV Analyst, UBS Investment Bank, Research Division; Michael Ng — Research Analyst, Goldman Sachs Group, Inc., Research Division | 4 |
Curated latest-call exchanges; one row per analyst topic.
| Analyst | Firm | Topic | What changed in Q&A |
|---|---|---|---|
| Sean Diffley | Morgan Stanley | Competitive backdrop and new value proposition | Asked how the fall device launch might intensify competition and which parts of the new go-to-market resonate with which cohorts; management said it was 40 days into the launch, cited gross adds and new-account growth ahead of forecast, and argued the basis of competition is shifting away from subsidies. |
| Michael Rollins | Citigroup | Replacing service revenue and hyperscale fiber | Pressed on how removing customer pain points also removes revenue sources, and on the dark-vs-lit fiber and capex of the AI opportunity; CFO pointed to volume growth, peaking promo amortization and ARPA accretion, and the CEO detailed AI Connect as success-based capital. |
| John Hodulik | UBS | Fixed wireless trajectory and satellite competition | Flagged the downward FWA add trend and LEO-constellation broadband threat; management defended the mix shift toward fiber and argued satellite cannot match terrestrial density economics in urban/suburban areas and ruled out any MVNO backdoor for satellite players. |
| Michael Ng | Goldman Sachs | 2027 revenue growth starting point | Asked whether the ~4% Q4 growth rate is a good jumping-off point for 2027 mobility and broadband service revenue; the CEO cited multiple structural tailwinds but declined to guide 2027 until the Q4 results call. |
Theme tracker
Themes are curator-classified across supplied calls.
| Theme | Status | Quarters mentioned | Read-through |
|---|---|---|---|
| Postpaid churn and retention as the core health metric | persisted | Q4 2024, Q1 2025, Q2 2025, Q3 2025, Q4 2025, Q1 2026, Q2 2026 | Churn ran through every call in the window. Under prior management it was framed as a transitory spike tied to price-ups; under Schulman it became the primary growth lever, improving from 95 bps (Q4 2025) to 90 bps (Q1 2026) to 84 bps consumer postpaid phone churn in Q2 2026. |
| Convergence (mobility plus broadband, Frontier) | persisted | Q4 2024, Q1 2025, Q2 2025, Q3 2025, Q4 2025, Q1 2026, Q2 2026 | A consistent strategic pillar; the Frontier acquisition (closed January 20, 2026) turned it into an execution story, with management repeatedly citing materially lower churn on converged cohorts. |
| AI infrastructure / AI Connect fiber monetization | persisted | Q4 2024, Q2 2025, Q3 2025, Q1 2026, Q2 2026 | Introduced by prior management in Q4 2024 as a sales funnel, it re-accelerated under Schulman and produced its first named material contract (Google, over $1 billion) in Q2 2026, reframed as an incremental 2027+ growth vector. |
| Cost transformation and multibillion OpEx/CapEx savings | emerged | Q3 2025, Q4 2025, Q1 2026, Q2 2026 | New with the CEO change: a $5 billion 2026 OpEx target introduced in Q4 2025, expanded to at least $9 billion of combined OpEx and CapEx savings by Q2 2026, framed as a multiyear program. |
| Share buybacks and accelerated capital return | emerged | Q4 2025, Q1 2026, Q2 2026 | Prior management treated buybacks as an eventual step after hitting leverage targets; Schulman announced a $25 billion authorization in Q4 2025, executed $2.5 billion in Q1 2026, and raised the 2026 target to up to $4.5 billion in Q2 2026. |
| Blunt price increases as a revenue lever | dropped | Q4 2024, Q1 2025 | Prior management leaned on repeated price-ups to drive service revenue; the new team explicitly abandoned price increases without added value and now laps roughly 180 bps of prior-year pricing as a self-imposed revenue headwind. |
| Public-sector / federal government disconnect headwind | dropped | Q1 2025, Q2 2025, Q3 2025, Q4 2025 | Recurred for a full year as a drag on business phone net adds tied to government efficiency efforts and a shutdown; by Q1-Q2 2026 management described the related disconnects as largely behind them and the topic fell away. |
Guidance ledger
Quotes, calls, and speakers are source-verified; outcomes are curator-classified.
| Verbatim guidance | Call | Speaker | Curator outcome | Outcome note |
|---|---|---|---|---|
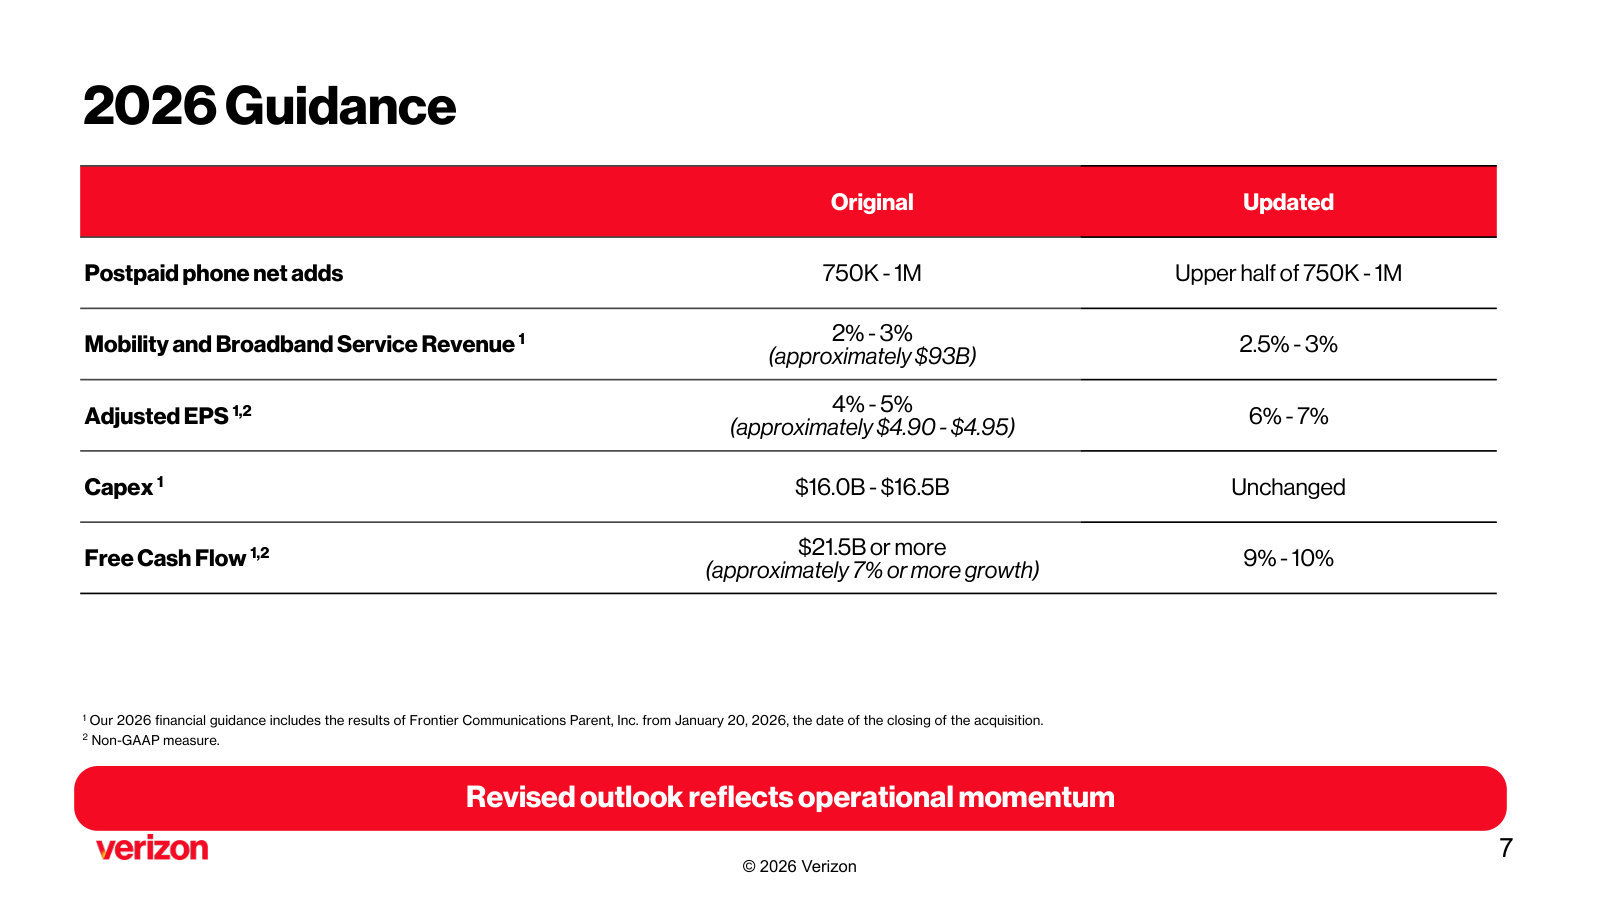
| “targeting a range of 750,000 to 1 million postpaid phone net adds in 2026.” | Verizon Communications Inc., Q4 2025 Earnings Call, Jan 30, 2026 · 2026-01-30T13:00:00 | Anthony Skiadas | pending | First-ever consolidated net-add guide; by Q2 2026 management said first-half adds put them on track for the upper half of the range, with the full year not yet complete. |
| “we expect adjusted EPS to be in the range of $4.90 to $4.95 for the full year, or year-over-year growth of 4% to 5%.” | Verizon Communications Inc., Q4 2025 Earnings Call, Jan 30, 2026 · 2026-01-30T13:00:00 | Anthony Skiadas | pending | Subsequently raised to 5%-6% in Q1 2026 and to 6%-7% in Q2 2026; full-year 2026 outcome not yet reported. |
| “We expect free cash flow to be $21.5 billion or more, growing approximately 7% or more, which will mark our highest free cash flow generated since 2020.” | Verizon Communications Inc., Q4 2025 Earnings Call, Jan 30, 2026 · 2026-01-30T13:00:00 | Anthony Skiadas | pending | Free cash flow growth guidance was later raised to 9%-10% in Q2 2026; full-year figure not yet reported. |
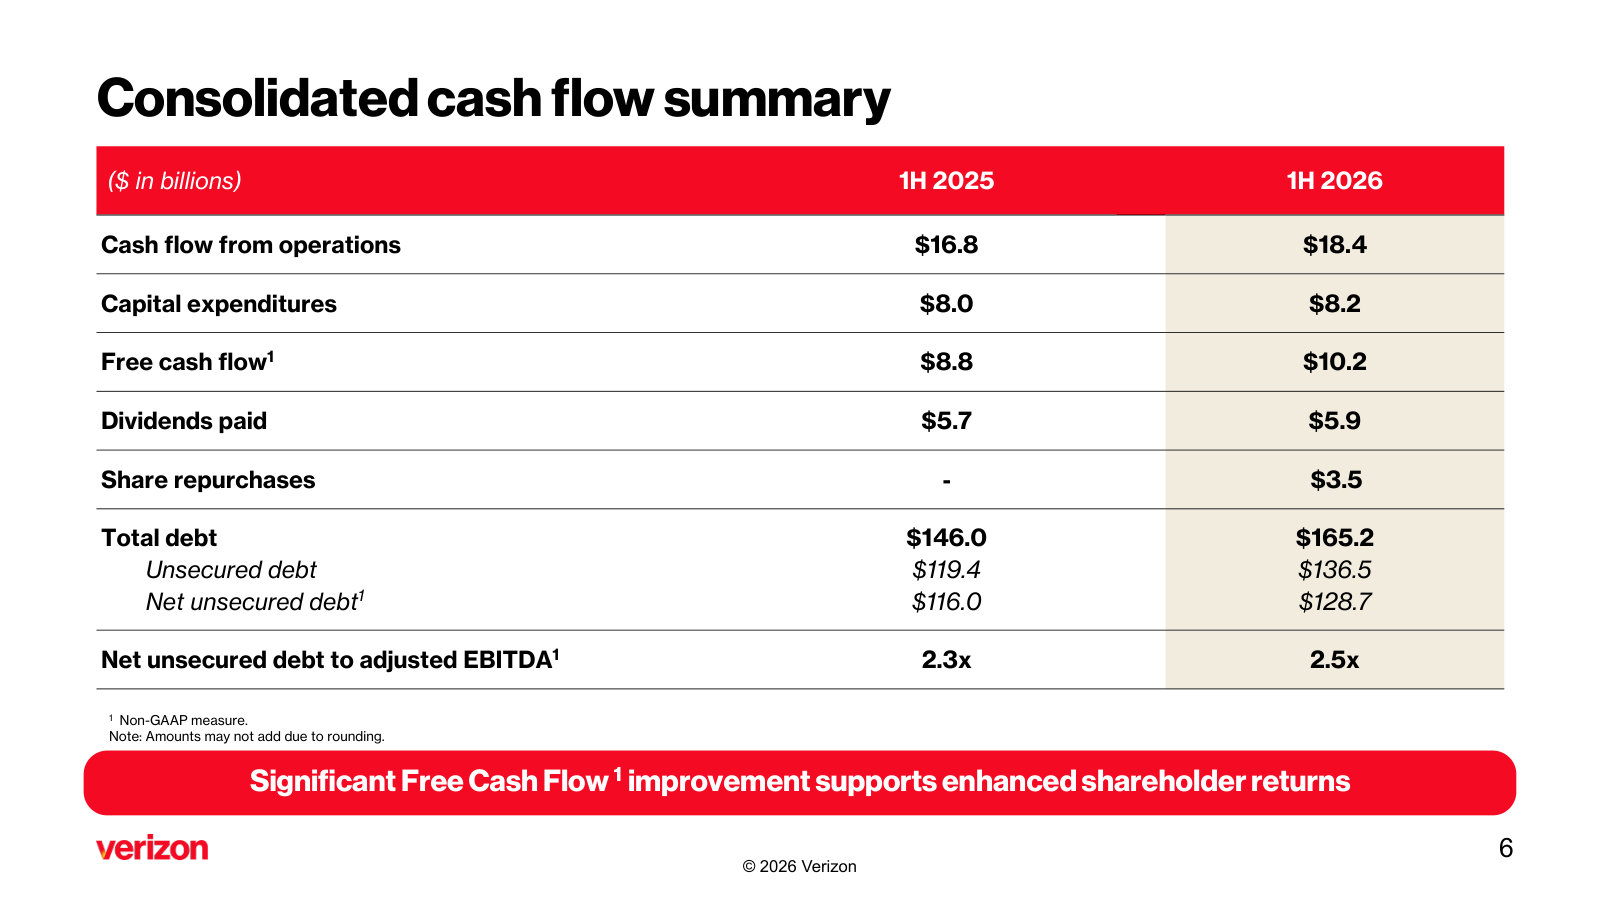
| “our Board has authorized up to $25 billion of share repurchases, which we expect to complete over the next 3 years with at least $3 billion of repurchases in 2026.” | Verizon Communications Inc., Q4 2025 Earnings Call, Jan 30, 2026 · 2026-01-30T13:00:00 | Daniel Schulman | pending | The 2026 buyback floor of at least $3 billion was already exceeded by mid-year ($3.5 billion year-to-date), and the 2026 target was raised to up to $4.5 billion in Q2 2026. |
| “we are raising our guidance for adjusted EPS growth to 5% to 6% versus the prior range of 4% to 5%.” | Verizon Communications Inc., Q1 2026 Earnings Call, Apr 27, 2026 · 2026-04-27T12:30:00 | Daniel Schulman | pending | Raised again to 6%-7% in Q2 2026; full-year 2026 result not yet reported. |
| “For the full year, we are now guiding revenues to grow 2.5% to 3%, the upper half of our previous 2% to 3% range.” | Verizon Communications Inc., Q2 2026 Earnings Call, Jul 24, 2026 · 2026-07-24T12:30:00 | Daniel Schulman | pending | Raised from the original 2%-3% mobility and broadband service revenue guide; full-year outcome not yet reported. |
| “we are raising our full year guidance for free cash flow growth from approximately 7% or more growth to 9% to 10% growth.” | Verizon Communications Inc., Q2 2026 Earnings Call, Jul 24, 2026 · 2026-07-24T12:30:00 | Daniel Schulman | pending | Second increase to the free cash flow outlook; supported by first-half free cash flow of $10.2 billion, up 16% year-over-year. |
| “our Q4 mobility and broadband service revenue is now anticipated to grow at approximately 4% year-over-year.” | Verizon Communications Inc., Q2 2026 Earnings Call, Jul 24, 2026 · 2026-07-24T12:30:00 | Daniel Schulman | pending | A forward quarterly acceleration target; Q4 2026 had not yet been reported in the supplied call history. |
Q&A pressure map
Question counts and firms are curator tallies; analyst coverage shown above.
| Topic | Questions | Firms | Pressure / response |
|---|---|---|---|
| New value proposition, churn and customer economics | 6 | Goldman Sachs, Citigroup, BofA Securities, Morgan Stanley | The dominant line of questioning across the last three calls: how net-add growth is funded (churn versus promotion), how ARPA and service revenue hold up as fees and pain points are removed, and how the Simplicity/loyalty economics work. Management answered directly, leaning on lower cost of acquisition and retention and subsidy-free adds. |
| Broadband, fixed wireless and satellite competition | 5 | UBS, Goldman Sachs, JPMorgan | Recurring pressure on the fiber-versus-FWA mix, the durability of the 8-9 million FWA target and LEO-satellite risk. Management reaffirmed the FWA target and argued satellite cannot compete on density economics. |
| Capital allocation, buyback cadence and CapEx efficiency | 3 | Morgan Stanley, JPMorgan, UBS | Analysts probed how much CapEx could be cut without hurting the network and the multiyear buyback pace. On cadence beyond the stated at-least-$3 billion, management declined to commit to specifics, citing hypotheticals. |
| AI Connect / hyperscale fiber monetization | 2 | Morgan Stanley, Citigroup | An emerging area of questioning as management surfaced the opportunity; analysts sought sizing, timing and capital intensity, and management framed it as success-based capital with revenue starting in 2027. |
Language shifts
Only language evidence verified against the referenced component is shown.
| Observation | Verbatim evidence | Call ID | Component |
|---|---|---|---|
| The incoming CEO opened his first full strategy remarks with unusually blunt self-criticism, a sharp break from prior management's 'our strategy is working' register. | “Verizon is clearly falling short of our potential.” | 1918115578 | 4 |
| New, explicitly risk-aware vocabulary about the company's own prior playbook: the practice of raising prices without added value was recast as a mistake to stop, not a lever to pull. | “We will not rely on empty price increases to drive short-term revenue and earnings.” | 1963016419 | 2 |
| Confidence language escalated quarter over quarter, from a turnaround described as gaining momentum in Q1 2026 to a claimed structural inflection in Q2 2026. | “our transformation is driving a structural and meaningful inflection in our results” | 1963016700 | 2 |
| The AI framing intensified from 'AI-first' toward a more absolute ambition, signalling rising rhetorical commitment to the technology as a cost and revenue driver. | “I want us to be not an AI-first company, I want us to be an AI-native company.” | 1963014798 | 23 |
The call history brackets a deliberate strategic reset: a new CEO arriving in late 2025 reframed Verizon from a price-led model to a volume- and retention-led one, and the two most recent quarters show churn, net adds and cash flow improving with guidance raised in each. The open question for the investment debate is durability — whether the new value-proposition economics hold, whether the promised AI-infrastructure revenue actually lands from 2027, and how much of the current optimism still rests on forward commitments rather than completed outcomes.
Competitors describe Verizon Communications Inc.'s market in their own filings and calls. These verified passages and visual pages show where their strategies meet, using source documents preserved in Sources.
T-Mobile US (TMUS)
Verizon's most direct wireless rival. T-Mobile names Verizon repeatedly on its own calls and in its 10-K, arguing it is closing the 'best network' perception gap, undercutting Verizon on price, and out-adding Verizon in postpaid — while its fixed wireless home-internet build attacks Verizon's Fios/FWA broadband franchise.
T-Mobile's CFO contrasts its postpaid account net adds and ARPA growth against its stated read that Verizon lost postpaid accounts and saw ARPU decline in the same quarter.
Peter Osvaldik, Chief Financial Officer: If you look at what we delivered, 217,000 postpaid account net additions up year-over-year and ARPA growth of 3.9%, that's what delivers the top-line service revenue that's so differentiated. By comparison, Verizon lost postpaid net accounts and had ARPU declines. If you step one level down, you see the formula here is more than device promotions. Best network, best value, best experience means customers are choosing to change their whole relationship and deepen that relationship, and that translates into core EBITDA leadership and free cash flow growth.
p. 10 · Read in context →
T-Mobile's 10-K names Verizon as a core wireless competitor and also cites Verizon's fixed wireless product as a direct broadband competitor to its own FWA.
We are the second largest provider of wireless communications services in the U.S. as measured by our total postpaid and prepaid customers. Our wireless communications services competitors include other carriers, such as AT&T Inc. (“AT&T”) and Verizon Communications, Inc. (“Verizon”). […] In addition to our wireless communications services, our broadband services compete against other broadband providers, including Cable, DSL and other Fiber broadband providers, other fixed wireless solutions, including AT&T and Verizon’s fixed wireless products, and satellite internet providers.
p. 8 · Read in context →
T-Mobile's CEO frames its 'best network' consumer-perception trajectory explicitly against Verizon, arguing the gap is closing and its network lead can widen.
Srini Gopalan, CEO: Now back in 2020, one in eight thought T-Mobile US, Inc. was the best network. One in two and a half thought Verizon was the best network. Today, we're at a place where one in four believe that T-Mobile US, Inc. is the best network, slightly more than one in four. And you can see that gap is closing. And you can see there's a long way for us still to go. We have the ability to meaningfully expand this lead.
p. 3 · Read in context →
AT&T (T)
The other national wireless carrier and Verizon's closest structural analog. AT&T is pushing a fiber-plus-wireless convergence strategy — a 60-million-location fiber build, OneConnect bundling and fixed-wireless 'Internet Air' — that it claims gives it a durable scale advantage over peers, and its management addresses Verizon by name on the competitive landscape.
An analyst frames the wireless landscape around leadership and promotional changes at Verizon; AT&T's CEO responds that competitors including Verizon will keep competing aggressively for share.
John Hodulik, Analyst (UBS), question; John Stankey, Chairman and CEO, answer: Maybe first on wireless, John, how would you say the company is positioned? If we see higher promotional activity in the fourth quarter given the changes at Verizon and T-Mobile actually? […] I actually don't believe many of my peers walk into their job and say my goal is to lose share and I'm going to deliberately do things to make that happen. I think most CEOs want to win, and I think they try to operate their business to win.
p. 7 · Read in context →
AT&T's stated claim to a 'structural advantage others will not catch' in converged fiber-plus-wireless — 90M advanced-internet locations, a 60M-plus fiber target, and OneConnect bundling — the converged model that competes with Verizon.
John Stankey, Chairman and CEO: After years of industry-leading investments in our fiber and wireless network, we believe that we have now established a structural advantage that others will not catch. We reached more than 90 million customer locations across the country with our advanced Internet services, over either fiber or 5G. We believe this provides us with more scalable reach and converged connectivity than any of our peers, including a meaningful scale and performance advantage in fiber. This is an advantage we're growing as we ramp our deployment at a faster pace than anyone else. Today, we reach over 37 million customer locations with fiber, and we're on track to reach 60 million plus locations by the end of the decade. […] You saw us lean into this advantage with the launch of AT&T OneConnect, the industry's first ever single subscription service for fiber and wireless with a flat monthly price.
p. 1 · Read in context →
AT&T's 10-K sizing of the shared broadband market that overlaps Verizon Fios and FWA: 10.4M fiber subscribers, 16.0M total broadband connections, and 1.5M Internet Air fixed-wireless connections.
We are a leader in providing connectivity services through our market focus areas of 5G and fiber. Fiber underpins the connectivity we deliver, both wired and wireless. […] At December 31, 2025, we had 10.4 million fiber consumer wireline broadband customers, adding 1.1 million during the year. […] At December 31, 2025, we had 16.0 million broadband connections, compared to 15.3 million broadband connections in the prior year. In areas where fiber services are not available, in recent years we have offered fixed wireless access under our AT&T Internet Air (AIA) brand. At December 31, 2025, we had 1.5 million AIA connections, adding 875,000 during the year.
p. 6 · Read in context →
Comcast (CMCSA)
A coopetitor: Comcast's Xfinity Mobile runs as an MVNO on Verizon's wireless network (a relationship it just 'modernized'), so Verizon earns wholesale revenue from it — yet Comcast competes hard with Verizon in residential broadband and in the converged mobile-plus-internet bundle, and names Verizon as a defined competitor in its 10-K. Exhibits cover only its connectivity business, not NBCUniversal.
Comcast describes its modernized MVNO on Verizon's network — the wholesale relationship underpinning Xfinity Mobile — alongside 9M+ lines and ~1.5M net adds for the year.
Michael J. Cavanagh, President: Turning to wireless, I am pleased to share that we have modernized our MVNO partnership with Verizon, supporting continued profitable growth for Comcast Corporation, Charter, and Verizon. With these enhancements, we have an even stronger relationship with Verizon to enable our customers to have a world-class experience. […] We added approximately 1,500,000 net lines, ending the year with over 9,000,000 total lines and roughly 15% penetration of our residential broadband base.
p. 2 · Read in context →
Comcast's 10-K names Verizon twice as a broadband competitor — through fiber overbuild and through 5G fixed wireless — defining the shared residential-internet battleground.
Certain wireline telecommunications companies, such as AT&T, Lumen and Verizon in the United States and BT and Virgin Media O2 in the United Kingdom, have built and are continuing to build fiber-based wireline network infrastructure further into their networks, which enables them to provide data transmission speeds that exceed those that can be provided with traditional copper digital subscriber line (“DSL”) technology, and are offering services with these higher speeds in many of our service areas. […] Various wireless companies, such as AT&T, T-Mobile and Verizon, offer internet services using a variety of wireless technologies, including 5G fixed wireless networks and 4G and 5G wireless broadband services.
p. 9 · Read in context →
Comcast cites a third-party (Opensignal) benchmark that it says ranked Xfinity ahead of Verizon in its footprint, paired with record Xfinity Mobile line adds.
Michael Cavanagh, President: Strong, consistent WiFi remains the #1 factor driving customer choice, and this is where we excel. Opensignal recently ranked Xfinity the top provider in our footprint, outperforming Verizon, T-Mobile, and AT&T in reliability, download speeds, and streaming. […] Third, we've accelerated momentum in wireless, now reaching more than 14% penetration of our broadband base and adding over 400,000 lines in the quarter, our best result yet.
p. 2 · Read in context →
Charter Communications (CHTR)
Like Comcast, Charter (Spectrum) both buys wholesale wireless from Verizon under an MVNO and competes against it — naming Verizon as its primary fiber-to-the-home broadband competitor and an MNO rival, pricing a $1,000 converged-savings guarantee explicitly against Verizon, and reframing itself as a facilities-based wireless provider.
Charter's 10-K names Verizon as a primary fiber-to-the-home competitor (about 16% of its footprint) and, separately, as a national mobile-network competitor.
Several FTTH competitors deliver 1 Gbps broadband speed (and some deliver multi Gbps) in at least a portion of their footprints which overlap our footprint. AT&T Inc. ("AT&T") and Verizon are our primary FTTH competitors. We face terrestrial broadband Internet (defined by the Federal Communications Commission (“FCC”) as at least 100 Mbps) competition from AT&T and Verizon in approximately 27% and 16% of our operating footprint, respectively. […] Our mobile service faces competition from national mobile network operators (“MNOs”) including AT&T, Verizon and T-Mobile, as well as a variety of regional operators and mobile virtual network operators.
p. 16 · Read in context →
Charter's CEO reframes Spectrum as 'the largest facilities-based wireless provider in the country,' arguing its Wi-Fi carries most of even the major carriers' traffic — a direct challenge to Verizon's network primacy.
Christopher Winfrey, President and CEO: To put it another way, and not to be provocative, I view us as the largest facilities-based wireless provider in the country. We offload roughly 87 to 88 percent of our own traffic, and WiFi is the workhorse of Spectrum and data delivery across our footprint. WiFi likely carries 75 to 80 percent of traffic for the mobile network operators, so our wireline and WiFi facilities provide wireless offload for us and for the major telcos.
p. 10 · Read in context →
Charter positions its converged $1,000 savings guarantee explicitly against Verizon (and AT&T and T-Mobile) as a pricing weapon in the bundle.
Christopher Winfrey, President and CEO: You've seen multiple competitors come out and try to talk about a savings guarantee; they don't do that against us. We do a savings guarantee against AT&T, T-Mobile and Verizon; we guarantee $1,000 of savings. Some have copied that idea.
p. 9 · Read in context →
EchoStar (Boost Mobile) (SATS)
The fourth facilities-based U.S. wireless carrier, building a cloud-native Open RAN 5G network to run Boost Mobile. Its 10-K lists Verizon first among the national carriers it competes with and names Verizon's own value brands — Visible, Tracfone and Total Wireless — as direct prepaid competitors to Boost.
EchoStar's 10-K lists Verizon first among the three national carriers it competes with, conceding they are 'significantly larger' with scale advantages Boost lacks.
We compete with a number of national wireless carriers, including Verizon, AT&T and T-Mobile, all of which are significantly larger than us, serve a significant percentage of all wireless subscribers and enjoy scale advantages compared to us as the only nationwide MNOs in the United States.
p. 91 · Read in context →
EchoStar names Verizon's value brands — Visible, Tracfone and Total Wireless — as primary competitors to Boost, highlighting where Verizon fights for prepaid and value customers.
Additional primary competitors to our Wireless segment include, but are not limited to, Metro PCS (owned by T-Mobile), Cricket Wireless (owned by AT&T), Visible (owned by Verizon), Tracfone Wireless (owned by Verizon), Total Wireless (owned by Verizon), Mint Mobile (owned by T-Mobile) and other MVNOs such as Consumer Cellular, Spectrum Mobile and Xfinity Mobile.
p. 91 · Read in context →
Lumen Technologies (LUMN)
The most direct competitor to Verizon Business rather than the consumer franchise: an enterprise/fiber-network operator claiming leadership in the AI-driven bandwidth build-out (Private Connectivity Fabric, Network-as-a-Service) and hyperscaler wins on the same enterprise and government turf Verizon Business targets. Lumen does not name Verizon in these filings; exhibits show the collision on strategy and scale.
Lumen's stated traction in the AI-backbone build: nearly $13B of Private Connectivity Fabric deals and a 58-million fiber-mile network expansion — the enterprise-connectivity market Verizon Business also pursues.
Kate Johnson, President and CEO: You may recall that just over eighteen months ago, we announced our first $5.5 billion in PCF deals with a goal of reaching $12 billion over time. As of today, we are now at nearly $13 billion with more deals in the pipeline. […] We successfully reached our 2025 goal of implementing 17 million intercity fiber miles. The roughly $2.5 billion of new PCF deals that we inked in Q4 will raise our total network expansion to a whopping 58 million fiber miles in 2031 while simultaneously expanding our capacity for enterprise customers.
p. 1 · Read in context →
Lumen's 10-K claim to be 'among the largest' enterprise communications providers, backed by 163,000 on-net buildings and 340,000 route miles of fiber — head-to-head with Verizon Business.
We are a leading digital networking services company, empowering enterprise businesses to fuel growth in a multi-cloud, AI-first marketplace by connecting people, data, and applications quickly, securely, and effortlessly. […] With approximately 163,000 fiber on-net buildings and over 340,000 route miles of fiber optic cable globally as of December 31, 2025, we are among the largest providers of communications services to domestic and global enterprise customers.
p. 5 · Read in context →
More peer documents
Q4_FY2025 — 14 pages · Stankey quantifies the convergence thesis in detail: 60M-location fiber target, a 42% fiber convergence rate, and a claim that fiber lifts AT&T's postpaid share ~10 points — the sharpest read on why fiber is a wireless weapon against Verizon. · Open →
Q2_FY2025 — 12 pages · Stankey defines the 'converged market' requiring both fixed and mobile assets and warns standalone overbuilders will struggle — the strategic frame behind AT&T's collision with Verizon. · Open →
Q4_FY2025 — 10 pages · Charter's prepared remarks lay out the structural Verizon MVNO agreement, ~90% network offload, and the big-three savings guarantee — a fuller version of the exhibits featured here. · Open →
Q3_FY2025 — 13 pages · A Morgan Stanley analyst names Verizon as 'a major competitor' that over-leaned on price increases and probes Charter's broadband/convergence pricing response. · Open →
Q2_FY2025 — 11 pages · CFO Armstrong frames the structural broadband threat — fiber overbuild plus a fixed-wireless 'niche' — and Comcast's DOCSIS 4.0 network-upgrade counter. · Open →
Q3_FY2025 — 7 pages · Johnson sizes the AI/cloud connectivity market (data-center footprints 10x by 2030), reports 1,500 NaaS enterprise customers and $10B of PCF deals, and claims Lumen is 'outperforming competitors' in business revenue. · Open →
Q4_FY2024 — 11 pages · EchoStar's CTO details the cloud-native Open RAN 5G build reaching 80%+ of Americans (268M POPs) and a third-party 'best network in NYC' award — the fourth-carrier network story behind Boost. · Open →
Q3_FY2025 — 7 pages · Technology president John Saw stakes 5G stand-alone and 5G Advanced network leadership over competitors and ties it to enterprise/first-responder services (T-Priority) that target Verizon's public-sector base. · Open →
Does Verizon fit Ruchir's system?
Does not fit the framework (P4b hard fail: rising share count); contested: P1, P2
Verizon is a large, essential, U.S.-listed oligopolist that clears the universe and trips no exclusion, but it does not fit the framework: the capital-allocation pillar (P4b) hard-fails because the diluted share count rose for a decade on stock-based compensation while buybacks ran at zero, and the framework treats a rising-share-count profile as a disqualifier regardless of the rest. Confidence is low: the two model families split on the year-10 gate (P1) and on FCF consistency (P2), and the name-mask probe flipped P1, so a prior_driven_risk flag stands. No exclusion hit; no watchlist_only flag.
Universe and exclusions — unsoftened
Nothing here is soft. Verizon passes every universe test and triggers no exclusion, and each check is cited.
Geography (U1) — met. Common stock of a Delaware-incorporated, New York-headquartered company, traded directly on the NYSE/Nasdaq under VZ [1]. No ADR or offshore-domicile wrinkle; not a Chinese issuer.
Market cap (U2) — met. About $196.2B (a $46.38 close on 24 Jul 2026 over 4.231B shares) — roughly 19x the $10B line.
Source: derived from fit_features.market_cap (price 2026-07-24; shares FY2025).
Car company (X1) — not triggered. An integrated telecom with two reportable segments (Consumer $106.8B, Business $29.1B) and zero vehicle manufacturing [2].
Market darling (X4) — not triggered. ~11x earnings, a ~6% dividend yield, flat revenue, and a Hold-heavy sell side — the inverse of the multiple-to-sales darling the exclusion targets. The counter-fact sits in the same breath: a cheap, unloved multiple can equally mark a value trap, which the Yield and Damage Math tabs adjudicate, not this screen.
China dependence (S1) — not material. 89% U.S. workforce [3]; disclosed translation exposure limited to Pound, Euro, Australian Dollar and Krona, with no renminbi named [4]; no restricted-vendor network equipment. The residual is a small, unquantified international enterprise-services slice.
Promotional CEO (X2) — not triggered. 2024 guidance was delivered and the fixed-wireless target beaten early; officers and directors hold well under 1% with no open-market buying. The counter-fact: the buyback repeatedly promised at ~2.25x leverage was deferred for years until a new CEO acted in 2026, and the new CEO's register is more promotional — treated in Self-Help.
Structural decline (X3) — checked, present only in the legacy tail. Business wireline operating income fell 39% since FY2018 and carries a $5.8B accumulated goodwill impairment, and copper carries a lead-cable liability [5] — but it is a shrinking share of a growing whole, so the company-level structural-decline flag is not met.
Pattern match
Of the reader contract's four setups, Verizon is closest to #2 — high dividend yield plus high FCF yield, business not going away (a ~5.9% dividend, a ~9-10% adjusted FCF yield, and an essential connectivity franchise). It is not #4 (a quality tech monopoly on a fear dip) because the drawdown is shallow and un-panicked, and it is not #3 (a healthcare/insurance forecasting error) because there was no one-year guidance cut — guidance was raised twice through the fall. The problem for the #2 read is that the pattern turns on the dividend not being cut, and the dividend is well covered (1.75x), but the entry the pattern also needs — a distressed price forced down by capitulation — is absent (see Dislocation). So the setup is recognizable but incomplete: the income leg holds, the fear leg does not.
The pillar ledger
Reference lines, not grades. Each pillar carries its deciding arithmetic and its strongest surviving counter-fact.
Year-10 durability gate (P1) — contested
The gate holds on structure but the jury split on it. Verizon sits in a three-carrier national oligopoly whose entry is gated by FCC spectrum on 10-year, routinely-renewed terms [6] [7], on top of a $157.0B indefinite-lived license base [8], and revenue rose from $126.0B (FY2016) to $138.2B (FY2025) with zero consecutive-decline years — the three-year high-single-digit-decline disqualifier is not tripped. The strongest counter-fact, in the same treatment: consolidated postpaid net adds collapsed 63% in 2025 (to 861K from 2,355K), and T-Mobile's CFO states Verizon "lost postpaid net accounts and had ARPU declines" [9]. That volume erosion is exactly why the jury contested the gate — Claude seats (a, b) read met, Codex seats (c, d) read not_met; trimmed-mean probability 0.73, spread 0.12, cross-family disagreement. Full treatment in Durability and Business.
FCF consistency (P2) — contested
Reported free cash flow held in an $18.7B–$23.6B band across FY2020–FY2025 except a dated 2022 dip to $14.1B on the C-Band capex peak ($23.1B) that recovered to $20.1B by 2025 [10] [11] [12]. So consistency holds on the filed record. The counter-fact that split the jury: the framework's own adjusted-FCF stability series (FCF minus SBC minus five-year acquisition average, rolling five years) is not_computable because the numeric feed lacks capex, SBC and acquisitions — so two Codex seats could not determine the pillar (a, b met; c, d cannot_determine). Treated in Durability and Yield.
Dislocation and yield (P3) — not met
Trigger (P3a) — not met. The March–July 2026 fall of 18.3% peak-to-trough carries no dated adverse event: the 8-Ks are a routine segment-reporting change and an immaterial $625M BT joint venture ($625M / ~$196B = 0.3% of cap) [13], and both quarterly prints in the window beat and raised guidance [14]. Counter-fact: the sharpest sessions (29 Jun –5.2%, 30 Jun –4.0%) overlapped the BT announcement, but a $625M item cannot plausibly drive a 9% two-day move.
Capitulation (P3b) — not met. The volume gauge reads only 1.22x the pre-peak median on a 20-day basis — a firm three weeks, not panic — against a history that holds 6x–20x sessions, none of which fall in this decline. Counter-fact in the same breath: individual trough days did reach ~2.1–2.3x and clustered at the low, the directional signature the framework wants, but 2.3x is not capitulation.
Source: derived from fit_features.capitulation_gauge.volume_spike.
Adjusted yield (P3c) — not met. On the most generous (business-acquisition-only) treatment the FY2025 adjusted FCF yield is 9.45% on the $196.2B market cap — ~55 bps under the 10% moderate-balance-sheet bar — and any charge for lumpy spectrum widens the gap to 8.2% (mid-cycle spectrum) or 3.5% (trailing C-Band-inflated acquisition average) [15] [16]. Counter-fact: on Verizon-defined unadjusted FCF the yield is 10.26% today — the shortfall is created by the framework's SBC-and-acquisition adjustment, not by weak cash generation.
Adjusted FCF = reported FCF − after-tax SBC − 5-yr avg acquisition spend; the 10% line is the framework's moderate-balance-sheet bar. Derived from FY2025 10-K cash-flow figures [17].
- Forward path (P3d) — not met. Consensus clears 10% on unadjusted FCF now (10.13% FY2025 → 15.12% FY2029), but on the normalized-adjusted basis the yield reaches 10% only around FY2028, and the crossing depends on a quiet spectrum cycle and an accretive Frontier ($22.3B, closed Jan 2026) [18] [19] — a genuinely balanced call: probability 0.54, spread 0.03, cross-family disagreement (one Claude seat met, three not_met). Full workings in Yield.
Balance sheet and self-help (P4) — the decisive fail
- Outlast capacity (P4a) — not met as a repurchase priority. Verizon can comfortably outlast its problem — the 2026 maturity of $17.3B is covered by $20.1B of annual FCF with a never-drawn $12B revolver behind it [20] — but management still ranks buybacks fourth, behind network, dividend, and deleveraging, with net-unsecured leverage at 2.5x and the target reached only in 2027 [21]. So repurchase headroom is the residual, not the priority.
- Repurchase engine (P4b) — not met. This is the hard fail that decides the framework. Here is the decisive point: the diluted share count rose every year for a decade, from 4,086M (FY2016) to 4,231M (FY2025), on stock-based compensation while buybacks ran at $0 in FY2024 and FY2025 [22] [23]. The framework treats a rising-share-count profile as an outright disqualifier — the buyback flywheel that the whole dislocation case is built on runs backwards. The strongest counter-fact, in the same breath: a $25B program authorized in January 2026 is executing — $3.5B repurchased by mid-year against a full-year target of up to $4.5B [24] [25] — but at ~$4.5B (about 2.3% of the $196.2B cap) it only starts to offset SBC, short of a demonstrated multi-year decline.
Diluted shares FY2016 (M)
Diluted shares FY2025 (M)
Buybacks FY2024–25 ($B)
2026 buyback target ($B)
Share count rose ~3.5% over the decade; buybacks were zero in FY2024–25. Source: FY2025 10-K income statement [26] and Note 8 [27]; 2026 program per Q2 2026 call [28].
The framework's levered exception cannot rescue it: that path needs a ~25%+ adjusted yield, a demonstrated multi-year share-count reduction, and non-deteriorating FCF — Verizon meets only the third (FCF grew to $20.1B, first-half 2026 up 16%). Two of three legs fail. The absurdity check also does not fire: at the current price it takes ~9.8 years of reported FCF to retire the whole float — a normal high-single-digit multiple, not the ~3-year figure that flags an impossible price.
- Dividend safety (P4c) — met. The ~5.9% dividend was covered 1.75x by FY2025 FCF (a 57% payout) and 2025 was the nineteenth consecutive year of increases, a streak spanning 2008–09 and the pandemic [29] [30]. Counter-fact: growth is glacial (~1.8%/yr) and rests on FCF that had declined ~1%/yr over the prior five years, so the payout is secure rather than compounding. Full treatment in Self-Help.
Diagnosis (P5) — met (temporary lean)
The temporary-versus-permanent question was tried by two opposing cited briefs and three blind judges, who put the probability the impairment is temporary at 0.66 (individual seats 0.54 / 0.67 / 0.66, mean 0.62, spread 0.13, not flagged contested). At the July trough of $41.99 the price matched a fully permanent scenario even though the panel assigns only ~0.34 to permanence, leaving a price-versus-value gap of ~$54B at the trough and ~$36B (~15%) at $46.38 — but that gap has roughly halved as the stock re-rated from $42 to $46, so the current price already pays for close to the standalone-permanent case [31]. Counter-fact: the gap is entirely assumption-driven (r = 9.0%, base FCF $21.5B), and if permanent decline runs faster than −3% it disappears. Full arithmetic in Damage Math.
Instrument context (I1) — not verifiable
Whether qualifying long-dated options exist and at what implied volatility could not be verified from the corpus: the only sources for a January 2028 expiry and a 25.58% 30-day implied vol are web references absent from the corpus (local data carries realized, not implied, volatility). Stated as a framework fact, not advice; see Clock. This is the run's single skeptic-unverifiable item.
What a 3x in three years would require
The framework's target test is re-rating math unavailable because the applicable bar or normalized adjusted FCF is missing — fit_features.adjusted_fcf and adjusted_fcf_yield are not_computable, so the tally records no bar-yield price, no implied market cap, and no upside figure. What can be stated, from the surviving Yield claims, is the reference arithmetic: clearing the 10% moderate bar at today's price needs adjusted FCF of about $19,623M against the current normalized ~$16,042M — roughly an 18% lift — which consensus reaches only around FY2028. And the base-rate context from Clock argues against a fast re-rating: Verizon's own 2019–2023 de-rating fell 50.6% over ~46 months and remains ~25% below its 2019 peak, and its 2000–2008 drawdown took ~18 years to round-trip; the one fast leg on record was +67.5% off the October 2023 low over ~29 months. There is no Meta-style vertical snap-back in this ~0.2-beta name. A 3x in three years is not what the arithmetic or the history supports.
Contested and undetermined
- P1 (year-10 gate) — contested. Claude seats (a, b) read met on structure; Codex seats (c, d) read not_met on the 63% collapse in postpaid net adds. Trimmed-mean probability 0.73, spread 0.12, cross-family disagreement. The name-mask probe read P1 as met, i.e. the mask flipped the gate — the basis of the
prior_driven_riskflag. - P2 (FCF consistency) — contested. Claude seats (a, b) read met on the filed FCF band; Codex seats (c, d) returned cannot_determine because the framework's adjusted-FCF stability series is not_computable from the numeric feed. No probability is recorded.
- Nothing else was undetermined: every other criterion carried a decisive verdict (no criterion resolved to cannot_determine at the tally level).
Provenance
| Item | Value |
|---|---|
| Jury families / seats | Claude (seats a, b) and Codex (seats c, d); mask seat = Claude |
| Cross-family agreement | Agreed on all criteria except P1 and P2 (both contested) |
| Order stability | temporary-first mean 0.66, permanent-first mean 0.605, gap 0.055 |
| Name-mask probe | Gate criterion differed on P1; max probability gap 0.0 → prior_driven_risk = true |
| Skeptic counts | 16 fully checked: 15 survived, 0 weakened, 0 refuted, 1 unverifiable (25 triaged-only) |
Source: fit_tally.json provenance and refutations.json.
The verdict was pressed hard: fifteen load-bearing claims were independently recomputed and all fifteen survived, none were refuted, and only the options/implied-vol facts (I1) came back unverifiable. The reason confidence is nonetheless low is not weak evidence but disagreement — the two model families genuinely split on the year-10 gate and on FCF consistency, and the name-mask probe flipped P1, so the framework flags that the gate read may be prior-driven rather than fact-driven.
The falsifier ledger
The standing conditions that would change the framework read, carried verbatim from the tally:
- adjusted FCF or EBITDA declines where flat-or-better was underwritten
- revenue declines for a third consecutive year
- capital allocation pivots to debt paydown over repurchases
- share count inflects upward
- the industry repricing cycle fails to materialize where industry-wide mean reversion was underwritten
- Q3/Q4 FY2026 FCF or EPS misses the raised guidance or guidance is walked back toward the original 4-5% EPS / ~7% FCF path, exposing the rebound as lapping/cost-cut/buyback sugar.
- Consumer postpaid churn re-accelerates above ~95bps or postpaid phone net adds turn negative — the volume-for-price swap failing.
- Mobility/broadband service revenue fails to reach ~3-4% organic growth in 2H26/2027 once the 180bps lap rolls off — 'volume replaces price' left unproven.
- Consumer reporting unit moves to a quantitative goodwill test with a narrowing fair-value cushion, or a new Consumer impairment is booked — core wireless earning power actually eroding, not just wireline.
- Q3 or Q4 FY2026 churn reaccelerates above about 0.95% or postpaid phone net adds turn negative after the outage credit laps.
- FY2026 adjusted EPS growth is cut below the original 4%-5% guide or free cash flow misses about $21.5 billion.
- FY2027 organic mobility and broadband service revenue remains below 2% despite normal promotion levels, showing the 180 bp price reset was not offset by volume.
- A new Business or wireline impairment, or Frontier-related leverage/capex overrun, consumes the verified cash-flow gains.
- Q3/Q4 FY2026 churn re-accelerates above ~95bps or postpaid phone net adds turn negative, showing the base (not just one quarter's ARPA) was damaged.
- FY2026 FCF falls short of $21.5B or the two guidance raises reverse, breaking the beat-and-raise cadence.
- A new Consumer goodwill impairment or a second Business impairment is recorded, or the 2027 deleveraging path stalls.
- Revenue growth stalls below the 2-3% floor with no offsetting FCF/EPS growth, confirming lost monetizable earning power rather than a mix choice.
Data gaps
- Adjusted FCF (FCF − SBC − 5yr-avg acquisitions), its rolling-5-year stability, adjusted-FCF yield, balance-sheet class and net debt all return
not_computablein fit_features because the numeric cash-flow feed omits capex, SBC and acquisition lines; every adjusted figure here was rebuilt from the filed 10-K cash-flow statements and should be reconciled into the feature file. - The structured feed's net-debt reading of −$0.4B captures only the $18,618M current-portion debt; true total debt is $158,150M and net debt $139,102M per the FY2025 debt note — the feature would otherwise mis-select the fortress bar.
- International/China revenue is not separately quantified in the FY2025 10-K; S1 immateriality rests on the 89% U.S. workforce, disclosed FX exposures, and the no-restricted-vendor statement rather than a percentage.
- Reported short interest is unavailable (data/short_interest empty), so any crowded-short unwind through the fall cannot be quantified; the corpus also lacks a benchmark/sector price series, so the rate-driven mechanism of the fall is inferred from the dividend-yield move.
- No dated source for long-dated (18-month) implied volatility; the 25.58% figure is the 30-day mean IV (2026-07-24), and the pre-run web-research pass was unavailable, so options/IV facts (I1) could not be verified against the corpus.
- Post-Frontier (closed 20 Jan 2026) pro-forma net debt, EBITDA and adjusted FCF are not in the filed FY2025 statements; the ~3.0x leverage and integration-capex estimates are directional.
- Exact credit-rating letters could not be confirmed; the filing states ratings were unchanged in 2025 and 2024 and Verizon remains investment-grade [32].
Business
Verizon is one of three U.S. national wireless carriers and a large fixed-broadband operator: $138.2 billion of FY2025 revenue, a roughly $196 billion market capitalization, about 89,900 employees, and revenue almost entirely domestic. It clears both universe tests — NYSE-listed U.S. common stock, market cap far above the $10 billion line — and trips none of the first-pass exclusions this tab can settle: not an automaker, not a consensus darling (about 11x earnings, roughly 6% dividend yield), and no material China exposure.
Universe screen
The two mechanical gates pass cleanly, and neither is close.
Geography (U1). Verizon Communications Inc. is a Delaware-incorporated holding company headquartered in New York, and its common stock trades on the New York Stock Exchange (and the Nasdaq Global Select Market) under the symbol VZ [1]. This is a domestically listed U.S. operating company, not an ADR and not a China-domiciled issuer — inside the universe on geography.
Market cap (U2). The deterministic market-cap feature computes $196.2 billion, at a $46.38 close on 24 July 2026 against 4.231 billion shares. That sits roughly 19x above the $10 billion threshold. Current market data through July 2026 puts the figure in a $182–193 billion band on intraday price; either way the test is not close. The 10-K itself records the aggregate market value of stock held by non-affiliates at $182.4 billion as of 30 June 2025 [2].
Market Cap ($M)
FY2025 Revenue ($M)
Operating Margin
Employees (FTE)
Sources: market cap derived from fit_features.market_cap.usd (price × shares, 24 Jul 2026); revenue and operating margin from FY2025 10-K, Consolidated Statements of Income [3]; headcount from Human Capital Resources [4].
What Verizon is
Verizon sells connectivity. It is a holding company that, through its subsidiaries, provides wireless, wireline, and broadband communications to consumers, businesses, and government entities, operating one of the most extensive wireless networks in the United States [5]. The company runs two reportable segments.
The Consumer segment is the business. Its FY2025 revenue was $106.8 billion — about 77% of the consolidated total — and at year-end it carried roughly 116 million wireless retail connections (83% postpaid) and about 11 million broadband connections [6]. The Business segment — mobility, fixed wireless and wireline broadband, IoT, and managed network services for enterprises, the public sector, and wholesale carriers — contributed $29.1 billion, about 21% of revenue [7].
Source: FY2025 10-K, Item 1 Business, segment revenue [8]; segment detail from Note 13 / data feed.
The economics concentrate even more than revenue does. Consumer generated $29.6 billion of segment operating income in FY2025; Business generated $2.5 billion on nearly the same revenue base as its own past — an 8.7% segment margin against Consumer's 28% [9]. Consumer supplies roughly nine-tenths of segment operating income. The mass-market wireless subscriber, paying a recurring monthly bill, is what this company earns from.
Source: FY2025 10-K segment disclosure (Note 13); consolidated operating income was $29.3 billion [10].
Geography. The footprint is domestic. About 89% of the roughly 89,900-person workforce is U.S.-based [11], and the company's only disclosed foreign-currency translation exposures are the British Pound, Euro, Australian Dollar, and Swedish Krona [12]. The international presence is a subset of the Business segment serving global enterprise customers; it is small relative to the $138 billion base.
Market structure
This is the raw material the Durability tab and the jury build on, so it is laid out to the page.
A three-carrier national oligopoly. In wireless connectivity Verizon states that it competes against the other national wireless providers — AT&T Inc. and T-Mobile US, Inc. — plus regional carriers and resellers [13]. The named national field is three companies. Verizon alone carried about 127 million consolidated retail postpaid connections at year-end. Against that, the honest counter-fact is that oligopoly is not the same as pricing power: the filing describes competition as remaining "intense," citing aggressive pricing, promotions, price locks, and offers "specifically targeting Verizon customers," with cable operators (Comcast, Charter) reselling wireless as MVNOs [14]. A concentrated structure that still competes hard on price is the accurate description.
Among the broader telecom-and-cable peer set, Verizon is the largest by revenue.
Source: FY2025 revenue as reported in company filings; Verizon per the FY2025 10-K [15]. AT&T, the third national wireless carrier, is of comparable scale; its FY2025 revenue is not resolved in this corpus.
Regulatory entry barriers and capital intensity. Verizon operates in a highly regulated market with the FCC as its primary federal regulator under the Communications Act of 1934 [16]. Wireless service requires FCC-licensed radio spectrum, allocated through competitive bidding; licenses run 10-year terms subject to renewal [17]. Verizon holds low-, mid-, and millimeter-wave spectrum covering nearly all of the U.S. population [18]. The capital gate is explicit in the numbers: the C-Band spectrum won in FCC Auction 107 alone carried roughly $7.5 billion of clearing costs on top of the license price [19]. A licensed-spectrum-plus-national-network business cannot be entered by a garage startup — the entry barrier is the kind Ruchir's system treats as durability evidence, alongside the long operating history of a company that runs incumbent local exchange operations in 31 states and Washington D.C. [20].
Essential, and consolidating further. Mobile connectivity and broadband are essential products, and the industry is still concentrating rather than fragmenting: Verizon closed its $22.3 billion acquisition of Frontier Communications on 20 January 2026 ($9.4 billion cash plus about $12.9 billion of assumed debt) [21], adding fiber-broadband scale, and has a pending purchase of UScellular spectrum. That is an oligopoly buying up the remaining independents, not a fragmenting field.
Revenue trajectory — the P1 disqualifier check
The one-line durability disqualifier is high-single-digit revenue decline for three consecutive years. Verizon does not trip it. Over the decade the deterministic feature file records revenue moving from $126.0 billion (FY2016) to $138.2 billion (FY2025) — up about 10% cumulatively, roughly a 1.5% five-year CAGR — with zero consecutive-decline years and the three-year-HSD-decline flag reading false.
Source: fit_features.revenue_trajectory (from company filings); FY2025 figure per the FY2025 10-K [22].
The read is a flat-to-slightly-growing mature utility, not a shrinking one. The counter-fact worth stating plainly: essentially flat top-line for a decade means this is an ex-growth business whose case cannot rest on revenue expansion — a point the Yield and Durability tabs carry. Whether year-10 revenue and free cash flow will be higher, with high conviction, is their verdict to reach, not this tab's.
First-pass exclusion screen
Automaker (X1). Verizon is an integrated telecommunications company; it sells no vehicles and has no automotive OEM operations. The auto-exclusion does not apply.
Consensus darling (X4). Verizon is the opposite of a multiple-to-sales darling. It trades at roughly 11x earnings ($46.38 close against FY2025 diluted EPS of $4.06) and yields about 6% on its dividend — a valuation the market assigns to a slow-growth income name, not a story stock. Sell-side coverage through July 2026 is Hold-heavy — of the analysts surveyed a clear majority rate it Hold, with no Sell ratings and a consensus 12-month target near $51, implying modest single-to-low-double-digit upside. The chart shape is a sideways-to-down income stock, not a bottom-left-to-top-right growth chart. There is no consensus story here that Ruchir would be late to; the darling exclusion does not apply.
P/E (price / FY25 EPS)
Dividend Yield
Revenue CAGR (5y)
Sources: P/E from $46.38 close (fit_features) over $4.06 diluted EPS, FY2025 10-K [23]; dividend yield per current market data, July 2026; 5-year revenue CAGR derived from reported financials.
China dependence (S1). This sensitivity flag is effectively absent. The workforce is 89% U.S.-based [24], the disclosed foreign-currency exposures are the Pound, Euro, Australian Dollar, and Krona with no Chinese renminbi named [25], and the company states it uses no network equipment from vendors currently under national-security restrictions [26]. China revenue and asset dependence are immaterial.
One fact this tab surfaces without owning it. Verizon's share count has drifted up, not down — from 4.086 billion shares (FY2016) to 4.231 billion (FY2025), a positive five-year CAGR of about 0.4%, with the feature file flagging the trend as rising. A framework whose engine is the buyback flywheel treats a rising share count as a real headwind; the capital-allocation reading belongs to Self-Help, and this tab only records the fact.
Dislocation — what happened to the price
Verizon fell 18.3% from a 13 March 2026 peak of $51.38 to a 1 July trough of $41.99, and has since recovered to $46.38 — down 9.7% from the peak. The fall carries no dated adverse event: it drifted lower on below-median volume, then dropped into the trough on a modest volume cluster (roughly 2.2x single-day median), and both the April and July earnings prints beat and raised guidance. On the framework's terms this is orderly repricing, not a fear-driven dislocation.
Peak (13 Mar 2026)
Trough (1 Jul 2026)
Current (24 Jul 2026)
Peak-to-trough
Source: daily closing prices; drawdown figures per the deterministic capitulation gauge (fit_features.capitulation_gauge).
The drawdown, quantified
The window is 13 March to 1 July 2026 — 110 calendar days from peak to trough, a shallow 18.3% decline. Two things frame it. First, the March peak was the top of a sharp rally: Verizon closed at $38.89 on 20 January 2026 and ran to $51.38 by mid-March, lifted by the Q4 2025 print (30 January, which drew 4.7x median volume) and the January close of the $20 billion Frontier acquisition [1]. At $46.38, the stock today still sits above where it started the year. Second, the decline came in two distinct legs.
Source: daily closing prices, as reported; peak/trough dates per fit_features.capitulation_gauge.
The first leg is drift. From the 13 March peak the stock slid to roughly $47.87 by 2 June — down 6.8% over eleven weeks — on volume that mostly ran below the pre-peak median. There is no event here; it is the slow bleed the framework explicitly discounts. The second leg is the drop into the trough: $47.87 on 2 June to $41.99 on 1 July, down 12.3% in four weeks, with the sharpest sessions clustered at the end (29 June −5.2%, 30 June −4.0%).
The trigger — an absence
The framework's entry condition is an identifiable, dated adverse event. Verizon's fall has none. The filings around the down-legs are benign: the 8-K dated to the 13 March peak is a routine change in how the company disaggregates segment revenue, not a guidance action [2]. The only company disclosure inside the terminal down-leg is a 28 June agreement to fold Verizon's international wireline business into a 50/50 joint venture with BT Group, alongside a $625 million cash payment [3] — a sum immaterial to a $196 billion company and not a plausible cause of a 9% two-day move.
Against that, the operating news through the fall was positive. The 27 April Q1 print delivered the first positive first-quarter postpaid phone net additions since 2013 and raised adjusted EPS guidance [4]. The 24 July Q2 print — the session that recovered the stock 5.8% — beat with adjusted EPS of $1.30, added 184,000 postpaid phones, and raised the full-year EPS outlook, with only a slight revenue shortfall [5]. A stock does not fall on beats and raises for company-specific reasons.
The most defensible read of the mechanism is rate-driven. Verizon pays a ~$2.71 annual dividend; that fixed payout made the trailing yield move from about 5.3% at the $51.38 peak to about 6.5% at the $41.99 trough. A bond-proxy dividend name re-rating ~120 bps of yield lower in price, with no fundamental trigger and no volume panic, is repricing against the discount rate — the "macro fear with a named mechanism" the brief allows, but a diffuse one, not an event. What that repricing does or does not do to intrinsic value belongs to the Damage Math tab, not here.
The fear gauge — no capitulation
The deterministic gauge measures the loudest 20-day stretch of volume in the fall against the pre-peak baseline. It reads 1.22x — the busiest three-week window in the decline carried only 22% more volume than the ~26.4 million-share daily median that preceded the peak. That is not capitulation; it is an orderly market clearing sellers at gently lower prices.
Source: daily share volume vs the 180-day pre-peak median (~26.4M shares); 20-day-average spike multiple of 1.22x per fit_features.capitulation_gauge.volume_spike.
The nuance the smoothed figure hides is worth stating. Individual sessions at the very bottom did carry elevated volume — 30 June traded 2.3x the median, and the 29 June–2 July cluster ran 2.1–2.3x on the biggest down days. This is where fear concentrated, at the trough rather than the start of the slide, which is directionally what the framework looks for. But 2.3x is a firm day, not a panic: Verizon's own history holds sessions at 6x to 20x median volume, and none of them fall in this decline. The emotion here was mild.
Who was selling
The evidence on seller composition is thin, and the honest answer is that the corpus cannot resolve it. Reported short interest is unavailable for this run — no FINRA position data, borrow-pressure, or public net-short disclosures were captured — so short-side positioning and any change through the fall cannot be quantified. There is no disclosed forced seller: no index deletion (Verizon remains a large-cap S&P component), no fund liquidation in the record. Insider activity through the drawdown was near-zero — 39 routine compensation grants and a single planned 10b5-1 sale of about $0.4 million by the Controller on 2 March, with no open-market insider buying to signal conviction either way. What can be said is negative evidence: the absence of a volume spike is itself evidence against forced or margin-driven liquidation, which shows up as heavy prints. This looks like ordinary holders trimming a rate-sensitive dividend stock, not anchored sellers dumping into an exit.
Estimates versus price timing
The framework's signature is a price that falls faster than the earnings estimate cut. Verizon shows the shape of that divergence, but without the cut. Across the peak-to-trough decline, consensus forward numbers barely moved: FY2027 EPS held at $5.25, FY2028 EPS eased 1.2% from $5.83 to $5.76, and FY2027 revenue slipped 1.4%. Over the same span the price fell 18.3% to the trough and remains 9.7% below the peak. The price move outran the estimate move by more than tenfold.
Source: price from daily closes; forward estimate revisions (90-day snapshot to current) from CapIQ consensus, data/sp/estimates.json.
Two qualifications keep this from being a clean setup. The estimates did not fall — they flattened after rising through 2025 and early 2026, so this is price falling against a stable forward, not price anchoring to a fresh cut in the Centene mould. And the divergence sits inside an unusually shallow decline: an 18% drawdown from a rally high, not the 60–70% forced-selling collapse the framework hunts. The consensus forward free-cash-flow yield does clear the framework's moderate 10% reference line — about 10.1% on FY2025 and 11.0% on FY2026 consensus — which says the sell side's own numbers imply the stock is not expensive; that computation and its bar belong to the Yield tab.
Bottom line
There is no dislocation here in the framework's sense. Verizon is down 9.7% from a March high that was itself the crest of a rally, on a fall with no dated adverse trigger, no earnings cut, and no capitulation in volume — two consecutive quarters beat and raised guidance through the decline, and the drop reads as a rate-driven re-rating of a dividend stock. The one framework-consistent feature is a price that fell far more than estimates, but that divergence is mild, sits atop stable-not-cut forwards, and lacks the fear event and forced selling the setup requires. The temporary-versus-permanent question does not arise from a trigger this tab could not find.
Verizon's 18% peak-to-trough drawdown was not driven by a cut to near-term earnings. Over the same window FY2026 free-cash-flow and adjusted-EPS guidance were raised twice, and forward EPS estimates rose 6–15%. The price damage is therefore a repricing of perpetual growth, not a lower cash forecast: at the July trough the price discounted a fully permanent impairment. Two independent briefs argued temporary versus permanent; the judges put the probability it is temporary at 0.66.
The near-term hit is an upgrade, not a cut
The numerator of a damage-math case is the fall in near-term consensus that the trigger caused. For Verizon over the March–July 2026 drawdown, that fall did not happen. Consensus moved the other way.
Forward normalized-EPS estimates were revised up across the window, while revenue estimates held roughly flat. Verizon has now beaten normalized-EPS consensus for eight consecutive quarters, most recently by 5.8% in Q1 FY2026 and 2.7% in Q2 FY2026; the revenue line is the one that has missed (−1.3% in Q1, −2.4% in Q2).
| Metric (consensus mean) | 180 days ago (Jan 2026) | Now (Jul 2026) | Change |
|---|---|---|---|
| FY2027 normalized EPS | $4.95 | $5.25 | +6.2% |
| FY2028 normalized EPS | $4.99 | $5.76 | +15.5% |
| FY2027 revenue ($B) | 141.7 | 144.2 | +1.8% |
| FY2028 revenue ($B) | 146.7 | 146.7 | flat |
Source: CapIQ consensus estimate momentum series, as of 2026-07-24 (data/sp/estimates.json), as reported.
The company's own guidance did the same thing. Verizon raised FY2026 adjusted-EPS growth guidance from the original 4–5% to 5–6% at Q1, then to 6–7% at Q2; it raised FY2026 free-cash-flow growth guidance from "approximately 7% or more" to 9–10%; and it nudged mobility-and-broadband service-revenue growth to the upper half of its 2–3% range [1]. Q2 adjusted EPS grew 6.6% to $1.30 and free cash flow was $6.4 billion, up 24% year-over-year [2].
| FY2026 guidance line | Original | Updated (Q2) |
|---|---|---|
| Adjusted EPS growth | 4% – 5% | 6% – 7% |
| Free cash flow growth | ~7% or more ($21.5B) | 9% – 10% |
| Mobility + broadband service revenue | 2% – 3% | 2.5% – 3% |
| Capex | $16.0B – $16.5B | Unchanged |
Source: Q2 FY2026 earnings presentation, 2026 Guidance [3].
The one genuine near-term cash hit in the window is small and self-dated: a January 2026 network outage forced customer credits that cut Q1 wireless service revenue by "approximately 80 basis points" — on $20.6 billion of quarterly wireless service revenue, on the order of $165 million, in one quarter [4]. Management framed Q1 as "the low point of 2026" [5] and the outage as "a one-time event [that] doesn't follow us through the rest of the year" [6].
So the numerator is close to zero. Whatever the market marked down, it was not the FY1/FY2 earnings forecast.
The price fell 18%; the forecast did not
Against a flat-to-rising forecast, the equity re-priced hard. The stock peaked at $51.38 on 13 March 2026, troughed at $41.99 on 1 July 2026 — an 18.3% drawdown — and has since recovered to $46.38 (24 July 2026). On 4.231 billion shares that is a $39.7 billion swing in market capitalization from peak to trough, of which about $21.2 billion remains at current prices.
| Peak (Mar 13) | Trough (Jul 1) | Current (Jul 24) | |
|---|---|---|---|
| Price | $51.38 | $41.99 | $46.38 |
| Market cap ($B) | 217.4 | 177.7 | 196.2 |
| Enterprise value ($B)¹ | ~363 | ~324 | ~342 |
| vs peak | — | −18.3% | −9.7% |
¹ EV adds net debt of ~$146B (total debt $165.2B at 1H 2026 less ~$19B cash) [7]. Market cap and drawdown derived from data/prices (fit_features.capitulation_gauge, fit_features.market_cap); shares from the FY2025 10-K.
Because Verizon carries roughly $146 billion of net debt against $196 billion of equity, the enterprise value moved less in percentage terms — about −10.7% peak-to-trough — but the equity took the full 18%. The consensus FY26 EPS line rose over the window; the market cap fell 18%. That divergence is the whole subject of this tab.
What a near-term hit can plausibly destroy
The gap between an 18% price move and a near-zero earnings cut has to resolve into a change in the perpetual growth the market assigns Verizon's cash flows. A transparent way to size it is a single-stage discount model on free cash flow to equity, with the assumptions stated on the page.
Assumptions (conservative, visible). Base free cash flow = FY2026 consensus of $21.5 billion [8]. Discount rate on equity r = 9.0% — deliberately above a strict CAPM read for a low-beta telecom, which makes the fair values lower and the test harder to pass. Value = FCF ÷ (r − g), where g is the perpetual growth of free cash flow. Solving each price for its implied g (g = r − FCF ÷ market cap):
| Price point | Market cap ($B) | Implied perpetual FCF growth g |
|---|---|---|
| Peak ($51.38) | 217.4 | −0.9% |
| Current ($46.38) | 196.2 | −2.0% |
| Trough ($41.99) | 177.7 | −3.1% |
Source: derived; base FCF $21.5B (FY2026 consensus), r = 9.0%, Gordon growth. Assumptions stated above.
Read plainly: even at the March peak the market was pricing Verizon's free cash flow to shrink about 0.9% a year forever. The drawdown moved that assumption to −3.1% at the trough, and it sits near −2.0% today. The two-scenario question is which of those is right.
Scenario A — temporary. If earning power is intact, consensus free cash flow compounds from $21.5 billion (FY26) toward $29.7 billion (FY29) and then settles to low-single-digit perpetual growth [9]. A perpetual g of 0% to +1% is defensible, giving a fair equity value of $21.5B ÷ (0.09 − 0.00) = $239B to $21.5B ÷ (0.09 − 0.01) = $269B — roughly $56 to $64 a share, above the peak. On this reading the trough was not damage at all but a mispricing of $60–90 billion.
Scenario B — permanent (a level shift). If pricing power is permanently lower, model the perpetual growth down to −2% to −3%: fair value $21.5B ÷ (0.09 + 0.02) = $196B to $21.5B ÷ (0.09 + 0.03) = $179B — about $42 to $46 a share. That is the trough-to-current price. In other words, the market at the July trough had already discounted the fully permanent impairment case.
The gap. Probability-weighting the two fair values by the trial's ruling — 0.66 temporary, 0.34 permanent — gives roughly 0.66 × $255B + 0.34 × $187B ≈ $232B, about $55 a share. Against the current $196 billion / $46.38, the price sits ~$36 billion (~15%) below that weighted value; against the $177.7 billion trough, the gap was ~$54 billion (~23%). The damage the price inflicted is larger than the probability-weighted damage the arithmetic supports — but the gap has narrowed by roughly half as the stock re-rated from $42 to $46, and it is entirely a function of the temporary-versus-permanent split, not of any cut to the near-term numbers.
Source: derived, two-scenario Gordon model; scenario probabilities from ruchir/trial/tally.json (p_temporary = 0.66).
The gap is real rather than absent, but it is not the clean bargain the trough implied: at $46.38 the price already pays for roughly the standalone-permanent scenario, so the remaining upside depends on the temporary reading holding. The forward free-cash-flow yield the same estimates imply — about 11% on FY2026 rising toward 15% on FY2029 — is developed in Yield; the durability of the cash that yield rests on is Durability; the shape of the drawdown itself is Dislocation.
The trial, both sides at their strongest
The temporary-versus-permanent question was argued by two opposing corpus-cited briefs and ruled on by three independent judges. Both cases have real evidence.
The case for temporary. The adverse event is identifiable and self-liquidating: the January outage's only lasting mark was the one-time ~80bps Q1 credit, and everything that governs long-run earning power moved the right way through the shock. Consumer postpaid phone churn fell 0.95% → 0.90% across the window; total postpaid phone churn was 0.92% in Q2, and Verizon posted its first positive first-quarter postpaid phone net adds since 2013, stepping up to 184,000 in Q2 — "our best in 5 years" for consumer [10]. Management calls Q2 "a structural and meaningful inflection" [11], and the two named revenue headwinds — the outage credits and ~180bps of lapping prior-year price increases — are both calendared to roll off, with promotional-cost of acquisition and retention already down 15% and 17% year-over-year [12]. Guidance rose twice; free cash flow rose 24%; the balance sheet held through the Frontier close at ~2.5x net unsecured leverage with the 20th consecutive dividend increase and buybacks lifted to $4.5 billion [13].
The case for permanent. Management itself admitted the prior earnings engine — pricing a saturated base — was destructive. New CEO Dan Schulman said growth had relied "too heavily on price increases" and "this cannot continue," and that Verizon would "no longer be the hunting ground for competitors" [14] [15]. The financial cost was quantified: raising price without value drove a 25bp churn rise, "2.25 million" lost net adds and "$3 billion-plus revenue a year," and foregoing further increases costs "about 180 basis points" of 2026 revenue — the reason the 2–3% guide replaced a 4–5% path that would have left Verizon "deeper in the hole" [16] [17]. The 10-K states the U.S. smartphone market is highly penetrated and industry customer growth will "continue to moderate," in a market of "aggressive pricing" and offers "specifically targeting Verizon customers" [18] [19]. And one segment has already been permanently written down: goodwill carries $5.8 billion of accumulated impairment charges against the Business reporting unit, and Business operating income has fallen from $4.168 billion (FY2018) to $2.532 billion (FY2025) [20].
The ruling. The panel put the probability the impairment is temporary at 0.66, with individual judges spanning 0.54 to 0.67 (spread 0.13); the ruling is not flagged contested, and it was stable to reading order (temporary-first mean 0.66 versus permanent-first mean 0.605, a 0.055 gap). This diagnosis probability is the trial's, not this tab's — the arithmetic above can size the gap but cannot re-decide the split. The judges' own flip conditions are concrete: a walk-back of the raised guidance, FY2026 free cash flow short of $21.5 billion, churn re-accelerating above ~0.95%, service-revenue growth failing to reach ~3–4% once the 180bp lap rolls off, or a fresh Consumer or second Business impairment.
Which line broke, and whether it self-corrects
The impairment is not one line; it is two, moving in opposite directions.
The genuinely permanent piece is Business wireline. It is small and already written down: the $5.8 billion Business goodwill impairment was taken in 2023 on "secular declines in wireline services," Business operating income is down 39% since FY2018, and management is now "reducing or eliminating noncore areas" — legacy copper, voice platforms, long-payback projects [21]. That decline is structural and unlikely to self-correct; but at ~$2.5 billion of a ~$31.7 billion consolidated segment operating-income base, it is not what a $40 billion market-cap swing is about.
The contested, larger piece is Consumer wireless — where the repricing mechanism is legible. The reset traded headline price for volume and retention: Consumer revenue rose to $106.8 billion (FY2025) from $95.3 billion (FY2021), and the drivers that determine whether that base compounds are recovering, not deteriorating — churn at multi-year improvement, net adds turning positive, ARPA rising, and unit acquisition and retention costs falling double digits [22]. The mechanism by which it recovers is a repricing calendar: the ~180bps of prior-price-increase lapping and the outage credits are dated to roll off, and "volumes-based revenues" are meant to replace them into 2027 [23].
Source: segment operating income and revenue by year, FY2018–FY2025 (data/financials/segment.json, data/financials/income.json), as reported.
The structural-decline evidence is therefore confined to a segment the market already discounts; the case against a permanent read on the core is that the wireless drivers self-correct on a stated calendar. That the layoffs, promotion cuts and buybacks flatter the near-term rebound is fair — and it is exactly what the judges' flip conditions test. The load-bearing fact remains that the price fell on a forecast that rose, so the damage is a bet on which line the market believed broke, priced at the trough as though it were the whole company.
Yield
On the framework's adjusted-FCF basis, Verizon generates roughly $18.5B of adjusted free cash flow in FY2025 — a 9.45% yield on today's $196B market cap, about 55 bps under the 10% bar its moderate balance sheet (net debt/EBITDA 2.8x) selects. Charge the business for spectrum at a normalized rate and the yield falls to ~8.2%; charge it at the C-band-inflated trailing average and it collapses to 3.5%. Under every treatment, the adjusted yield sits below the bar. Consensus reaches 10% on a normalized basis only around 2027–2028.
The deterministic feature file returned adjusted_fcf, yield_baseline, and balance_sheet_class as not_computable — the structured cash-flow feed lacked the capex, stock-based-compensation, and acquisition lines, and the balance-sheet feed captured only current-portion debt (making the derived net-debt figure −$0.4B, a fortress-looking artifact). Every figure below is rebuilt from the filed 10-K cash-flow and balance-sheet statements, cited to the page. The gap is logged for the Fit tab.
The adjustment, line by line
Verizon's own "free cash flow" is operating cash flow minus capital expenditures — nothing else. It explicitly excludes both business acquisitions and spectrum ("wireless licenses") purchases [1]. The framework's adjusted FCF goes further: it subtracts stock-based compensation and the 5-year average of acquisition spend, so a company cannot count cash it must keep spending to acquire its future as if it were free.
The raw components across the last five years show why the acquisition line is the whole argument for Verizon:
Sources: FY2025 10-K, statements of cash flows [2] and stock-based compensation note [3]; FY2023 10-K [4] and FY2022 10-K [5] for 2021–2022 figures.
Stock-based compensation is small for Verizon — $815M after-tax in FY2025, never above 4% of reported FCF [6]. The acquisition line is where the treatment matters. Business acquisitions are trivial (a Tracfone tail in 2021, nothing since): a five-year average of $769M. But spectrum is enormous and lumpy — the 2021 C-band auction alone cost $47.6B [7], which by itself is 82% of the five-year license total and lifts the average acquisition charge from $769M to $12.4B a year.
Because the two treatments diverge so far, the FY2025 adjustment is shown three ways rather than one:
Source: derived — reported FCF and acquisition lines per FY2025 10-K [8] [9]; market cap $196.2B ($46.38 × 4,231M shares, 24 Jul 2026). All figures $M.
The middle row is the defensible reading, and the normalization is set out below. The point of the three rows: the reader can pick any spectrum assumption and recompute — and none of them clears 10%.
Which bar applies — the balance-sheet class
The framework scales the bar to the balance sheet, and the class turns on net debt to EBITDA. The filed figures:
Source: total debt $158,150M [10] and cash $19,048M [11]; Consolidated Adjusted EBITDA $49,997M [12]. Ratio 2.78x shown as 278 for display.
Net debt of $139.1B against $50.0B of Consolidated Adjusted EBITDA is 2.78x — above the framework's fortress line (≤0.5x) and below its levered line (≥3.0x). Verizon is a moderate balance sheet, so the 10% adjusted-yield bar applies, not the ~8–9% fortress line or the 25% levered line. This matters because the parsed data feed, reading only $18.6B of current-maturity debt, produced a −$0.4B net-debt figure that would have mislabelled Verizon net-cash and dropped the bar to 8–9% — a class error the filed statements correct.
The Frontier acquisition closed on 20 January 2026 [13], after the FY2025 balance-sheet date. It adds roughly $10B of assumed and acquisition debt plus integration capex; on a full-year basis net debt/EBITDA moves toward ~3.0x — the moderate/levered boundary. The class holds at moderate on management's deleveraging plan, but the margin is thin and worth watching.
The yield, three ways
Verizon is a structurally high-yield name, not a fortress that suddenly re-rated. On reported FCF, its yield has run 8.5–11.8% every year since 2020; on the adjusted (business-acquisition) basis it has held near 10.8% since 2023. The current 9.45% actually sits below that recent baseline — because today's price ($46.38) is above the 2022–2024 year-ends, not below them.
Source: derived — adjusted FCF (reported FCF − after-tax SBC − $769M 5-yr avg business acquisitions) and reported FCF divided by year-end market capitalization; 10-K cash-flow statements [14] [15], year-end closing prices as reported.
Read three ways, on the business-acquisition basis:
Current adjusted yield (FY25 on today's mkt cap)
3-yr-avg adjusted FCF / today's mkt cap
Own 5-yr adjusted-yield baseline (median)
Source: derived — 3-yr-avg adjusted FCF (FY2023–FY2025, ~$18.0B) on the current $196.2B market cap; baseline is the median of the five annual adjusted yields above.
The distribution reads plainly: Verizon's adjusted yield has clustered around 10.8% at its recent year-end prices, current sits at 9.45%, and the three-year average is 9.2%. There is no jump here of the fortress kind the framework hunts (a stable 3.5–4% name suddenly at 8–9%). Verizon has always yielded near double digits; the recent 18% drawdown (Dislocation) has, if anything, left the entry yield modestly below its own baseline rather than at an extreme — because the price today is higher than it was through most of 2022–2024.
Position against the bar
On the business-acquisition basis the arithmetic is clean: 9.45% adjusted FCF yield against the 10% bar — 55 bps short. Weight the spectrum more heavily and the gap widens. The three readings, against the same reference line:
Source: derived from the FY2025 adjustment waterfall above; the 10% line is the framework's moderate-balance-sheet reference.
The gap to the bar is 55 bps on the most generous reading and 650 bps on the most punitive. What the framework is really pricing here is whether spectrum is a capital cost of the telecom (like capex, and so already inside reported FCF's exclusions) or "bought growth" (and so a charge against yield). The honest answer is between: spectrum is genuinely required to run the network and is genuinely lumpy, so neither the current-year low ($450M) nor the C-band-inflated trailing average ($11.7B) describes the recurring burden.
Normalized mid-cycle yield
Verizon is not cyclical in the industrial sense, but its cash flow carries a clear spectrum-and-capex cycle, and today's reported FCF sits near the favorable end of it. Capex peaked at $23.1B in 2022 during the C-band build and has since fallen to $17.0B [16]; spectrum spend has fallen from $47.6B in 2021 to $450M in 2025 [17]. Both inputs are near a cyclical trough of spending, which means reported FCF of $20.1B is closer to a cyclical high than a depressed level — the opposite of the classic dislocation set-up.
The normalization therefore charges a mid-cycle spectrum run-rate rather than the trough. The assumption, stated so a skeptic can recompute under an alternate: spectrum averages ~$2.5B a year through a cycle — roughly the blend of several quiet $0.5–1B years and a periodic multi-billion auction, and well below the $11.7B trailing average distorted by one C-band event. On that basis:
Normalized adjusted FCF = $20,126M reported FCF − $815M SBC − $769M business acquisitions − $2,500M normalized spectrum = $16,042M, a 8.2% yield on the $196.2B market cap.
Under an alternate $2.0B spectrum assumption the figure is 8.4%; under $3.0B it is 7.9%. The window is narrow and the conclusion is stable: normalized for the spectrum cycle, Verizon yields ~8.0–8.4% — about 160–200 bps under the 10% bar, and the gap does not close by choosing a friendlier point in the cycle, because the current point is already friendly.
The consensus check
Consensus is where the reported-versus-adjusted distinction does its work. On a straight (unadjusted) free-cash-flow basis, the sell side already clears the bar comfortably and rising:
Source: consensus free-cash-flow estimates (CapIQ, vintage 25 Jul 2026), fit_features.consensus_forward_yield from data/sp/estimates.json; unadjusted yield as provided, normalized-adjusted subtracts ~$3.3B (SBC + normalized spectrum) from each year's consensus FCF, divided by the current $196.2B market cap.
The vendor metric that proxies for adjusted FCF here is consensus free cash flow (operating cash flow minus capex — Verizon's own definition), which like reported FCF does not net out SBC or spectrum. Left unadjusted it reads 10.1% in FY2025 rising to 15.1% by FY2029 — the sell side plainly agrees Verizon is a double-digit cash generator. Apply the same normalization used above (subtract ~$3.3B for SBC and mid-cycle spectrum), and the consensus-implied adjusted yield is ~9.3% in FY2026, crosses 10% around FY2028, and reaches ~13% by FY2029.
So the setup is not "consensus already agrees you are above the bar." Consensus agrees Verizon clears 10% on unadjusted FCF now; the framework's adjustment is exactly what keeps it below the bar in the near term. The forward path back above 10% on the adjusted basis exists and is underwritable, but it is real work, not a given:
- Mechanism. Capex holds at ~$17–18B while service revenue grows low-single-digit; spectrum stays quiet (no major auction before ~2028); Frontier integration turns cash-accretive rather than consuming FCF. Each pushes adjusted FCF from ~$16B toward the ~$19.6B needed to hit 10% at today's price — an ~18% lift, which consensus reaches on unadjusted FCF by FY2027–FY2028.
- What could break it. Frontier just closed and adds debt and near-term integration capex [18]; the FY2029 consensus jump to $29.7B is large and back-end-loaded; and a fresh spectrum auction would reset the acquisition charge upward.
- Probability. On these estimates, roughly a 50–55% chance the adjusted FCF yield on today's market cap clears 10% within three years (by ~FY2028), contingent on spectrum staying near $1–2B and Frontier proving accretive. That is a genuinely balanced call, not a high-conviction reversion — the yield sits close to the bar, but reaching it depends on a quiet spectrum cycle the company does not fully control.
FCF-to-revenue conversion
The conversion trend is stable-to-improving, which supports the durability case rather than undercutting it. FCF/revenue dipped to 10.3% in 2022 at the C-band capex peak, then recovered to ~14.6% and has held there for three years:
Source: derived — reported FCF ÷ total revenue, FY2020–FY2025 10-Ks [19] [20].
Conversion is not deteriorating — the 2022 dip was a capex event, not margin erosion, and it has fully unwound. That matters for the wider read: a company whose FCF/revenue was sliding would fail the framework's own falsifier, and Verizon's is flat-to-up. The pressure on the yield case comes not from conversion but from the price (today above its recent lows) and from the spectrum charge, not from the underlying cash engine losing efficiency. The durability of that engine is examined in Durability; the debt that sits against it, and the buyback-versus-deleveraging tension the moderate balance sheet creates, in Self-Help.
Durability
Verizon is a large, essential, capital-heavy oligopolist: three national carriers, spectrum the FCC hands out and routinely renews, a $157.0 billion license base no entrant can replicate, and 147 million wireless connections that customers pay through recessions. Revenue rose from $126.0B (FY2016) to $138.2B (FY2025) — the three-year decline disqualifier is not triggered. The year-10 gate holds. The genuine doubt sits inside the FCF trajectory, not the revenue base: T-Mobile and cable resellers are visibly compressing Verizon's volume growth.
The conviction sources, evidenced one by one
The year-10 gate asks whether revenue and adjusted free cash flow will, with very high conviction, be higher in a decade. Verizon's conviction comes from structure, not execution — the framework grants no year-10 credit for out-executing. Each source below is graded for this company.
Market structure — a three-carrier oligopoly, held. US facilities-based wireless is a three-firm market: Verizon competes against AT&T and T-Mobile nationally, plus regional carriers [1]. The Business tab sizes the shares; the durability point is stability — Verizon carried roughly 116 million Consumer wireless retail connections at the end of 2025, and consolidated postpaid connections have grown every year from 113.4 million (2018) to 126.7 million (2025) [2]. The structure is durable; the share within it is the contested variable, examined below.
Regulatory entry barriers — real, and the strongest single source. Every wireless service requires FCC-licensed radio spectrum; licenses run roughly ten years and are acquired only by purchase, lease, or competitive FCC auction [3]. "The FCC has routinely renewed all of Verizon's wireless licenses" [4]. A garage startup cannot enter; the regulator gates supply. This applies fully.
Capital intensity as a moat — the license and network base. The carrying value of Verizon's wireless licenses was approximately $157.0 billion at December 31, 2025, treated as an indefinite-lived asset because no legal, competitive, or economic factor limits their useful life [5]. On top of that sits a national network covering roughly 147 million wireless connections and 14 million broadband connections, plus one of the largest global fiber networks [6]. Replacement cost is a genuine barrier; it is also the source of the capex burden that shapes the FCF doubt. This applies fully.
Essentialness — connectivity, paid through cycles. The Consumer segment alone generated $106.8 billion, about 77% of revenue, serving 116 million wireless connections of which 83% are postpaid [7]. Postpaid churn ran 1.15% in 2025 — customers do not leave, and a phone bill is among the last things a household cuts. Demand held through 2020's downturn (revenue $128.3B, down only 2.7%). This applies fully.
Operating history — long, but the useful lineage is the franchise, not the ticker. Verizon has operated as a public company since the 2000 Bell Atlantic–GTE merger, atop Bell operating companies whose service areas predate the 1984 divestiture; the demonstrable durability is the FCC's routine license renewals over decades [8] and a wireline footprint still spanning 31 states [9]. This applies.
The disqualifier check — the revenue history
The framework's one hard disqualifier is revenue declining high-single-digit for three consecutive fiscal years. fit_features.revenue_trajectory records consecutive_decline_years: 0 and three_year_hsd_decline: false.
Source: fit_features.revenue_trajectory, from Verizon FY2016–FY2025 Form 10-K filings; FY2025 total operating revenues of $138,191M confirmed in the FY2025 10-K [10].
The two down years in the decade — 2020 (−2.7%) and 2023 (−2.1%) — are shallow, non-consecutive, and well short of the high-single-digit bar. Over ten years revenue compounded at roughly 0.9% a year: durable, but barely growing. For the disqualifier, that is unambiguous — the flag is off. For conviction on growth, the flat trend is what the threats section has to weigh.
The structural threats, hunted
Execution is not a moat, and a franchise this stable can still lose share at the margin. A real search of Verizon's own filings and its rivals' finds three named, cited threats — one of them biting now.
T-Mobile is taking Verizon's postpaid growth. This is the live one. Consolidated postpaid net additions collapsed from 3.29 million (2023) to 2.36 million (2024) to 861 thousand (2025) — down 63% in 2025 alone, and 74% over the two years since 2023, while the connection base kept inching up.
Source: Verizon segment KPI disclosures, FY2018–FY2025 (company filings, as reported); the 2025 Consumer postpaid net-add decline of 56.8% is stated in the FY2025 10-K [11].
T-Mobile presses exactly this point in its own disclosures: its CFO stated that against T-Mobile's postpaid account adds and 3.9% ARPA growth, "Verizon lost postpaid net accounts and had ARPU declines" in the same quarter [12]. T-Mobile also reports the "best network" perception gap closing — from one-in-eight thinking T-Mobile best in 2020 to better than one-in-four now, against Verizon's lead eroding [13]. Perception is the moat that a premium-priced carrier actually sells. Plausible year-10 impact: if Verizon's postpaid base stops growing and drifts down 1–2% a year, wireless service revenue (roughly $69B of the total) stalls or slips — the difference between the durable-but-flat base and outright volume decline.
Cable MVNOs — "your margin is my opportunity," partly at Verizon's own hand. Comcast and Charter resell wireless service as MVNOs, and several major cable operators bundle wireless — competing directly on price and, in cable's case, riding partly on Verizon's own network economics [14]. T-Mobile's fixed-wireless home internet and Verizon's own FWA are simultaneously attacking cable broadband [15]. This is a two-way margin raid across wireless and broadband; it is why pricing "specifically targeting Verizon customers" recurs in the filing's competition language [16].
Secular decline in legacy video and copper (the X3 read). Structural decline exists — inside Verizon, not across it. Fios video connections fell every year from 4.38 million (2018) to 2.44 million (2025), −9.1% in 2025 alone [17], and the copper network carries a lead-sheathed-cable liability that could bring remediation and litigation costs Verizon cannot yet estimate [18].
Source: Verizon Consumer segment KPI disclosures, FY2018–FY2025 (company filings, as reported); FY2025 figures in the FY2025 10-K [19].
The X3 verdict at the company level is checked-and-absent: legacy video and copper are in genuine structural decline, but Fios internet (5.76M to 7.33M) and total broadband more than offset them, and consolidated revenue rose. Verizon is not a structurally declining business; it houses a shrinking legacy tail inside a flat-to-growing whole.
The counter-nuance that keeps the base intact: price. As volume growth stalled, Consumer postpaid phone ARPA still rose to $147.31 in 2025, up 2.3%, on top of +4.5% the year before [20]. An oligopolist that can raise price ~2% a year while adding almost no accounts still grows service revenue slowly. Pricing power, not volume, is doing the durability work — and pricing power is exactly what the T-Mobile perception threat aims at over a decade.
FCF consistency (P2)
The deterministic fit_features.fcf_stability series is not_computable — the numeric feed lacks capital expenditure, stock-based compensation, and acquisitions, so the profile's adjusted-FCF series (adjusted_fcf) is empty and the rolling 5-year average cannot be built. The adjusted-yield computation and its bar live in the Yield tab; this tab reads consistency off the filed record instead.
Verizon reports free cash flow directly (operating cash flow less capital expenditure) in each 10-K. Operating cash flow is strikingly stable — $37–42 billion for eight straight years — and reported FCF has one explicable dip:
Sources: FY2025 10-K free-cash-flow reconciliation [21]; FY2023 10-K [22]; FY2021 10-K [23]. Reported FCF = operating cash flow − capital expenditure; it is not the profile's adjusted FCF, which additionally subtracts SBC and a 5-year acquisition average.
Reported FCF held in an $18.7–23.6 billion band every year except 2022, when it fell to $14.1 billion [24]. That dip is not a broken business model — it is the C-Band 5G build, when capex spiked to $23.1 billion; as the build rolled off, capex fell to $17.0 billion and FCF recovered to $20.1 billion by 2025 [25]. This is the framework's "volatile year-to-year is fine, unpredictable is not" — the volatility is a known, dated capex cycle, not an underwriting shock. On the filed record, FCF consistency holds; the caveat a reader must carry is that this is reported FCF, and the SBC/acquisition adjustment the framework requires is not computable here.
The year-10 case, both ways
The strongest case that year-10 revenue and FCF are higher. Connectivity is essential and paid through cycles; supply is gated by an FCC that has never failed to renew Verizon's licenses; the license-and-network base ($157.0B in spectrum alone) cannot be replicated by an entrant; revenue has risen over a decade with pricing power still lifting ARPA ~2% a year; and consensus estimates carry FCF up, from roughly $19.9B (FY2025) toward $29.7B by FY2029 as the C-Band capex cycle normalizes. A large, essential, capital-heavy oligopolist is precisely the shape the durability gate is built to pass.
The strongest doubt. The doubt is not whether Verizon exists in ten years — it is the slope. Postpaid net adds fell 63% in 2025 (74% over the two years since 2023), T-Mobile is closing the network-perception gap that justifies Verizon's premium price, and cable MVNOs raid margin from both sides. If share erosion turns Verizon's flat volume into slow volume decline, the ~0.9% revenue trend could go negative, and FCF — sensitive to a capex line that is not discretionary — would depend entirely on price offsetting a shrinking base. Consensus assumes the opposite.
My read, stated once: the year-10 gate holds. Verizon's revenue and free cash flow are very likely higher in a decade than today, because the structure — oligopoly, spectrum, capital intensity, essentialness — protects the base regardless of execution, and the disqualifier is not triggered. The genuine doubt to carry, and it is genuine rather than perfunctory, is competitive: T-Mobile and cable are compressing Verizon's growth now, and if that hardens from slowing adds into volume decline, the "higher FCF" half of the gate rests on pricing power alone. What would move the read to a fail: consolidated postpaid connections turning negative for consecutive years, or ARPA growth stalling while net adds stay negative — the point at which price can no longer carry a shrinking base.
Self-Help
Verizon can comfortably outlast its problem — investment-grade, a laddered maturity wall against $20 billion of annual free cash flow, and a $12 billion undrawn revolver with no financial covenants. But the repurchase engine the framework wants was absent for a decade: the share count rose every year from 4.09 billion to 4.23 billion while buybacks ran at zero. A $25 billion program only switched on in January 2026 — real, but six months old.
The balance sheet against the problem's duration
Verizon carried $158.2 billion of total debt at the end of 2025, up from $144.0 billion a year earlier, at a 5.0% effective interest rate [1]. Against $19.0 billion of cash, net debt is roughly $139 billion. On Verizon's own preferred yardstick — net unsecured debt to consolidated adjusted EBITDA — leverage sat at 2.5x at the end of Q2 2026, improving 0.1x in the quarter, with management "on track to reach our target leverage range during the 2027 time frame" [2]. Measured against consolidated EBITDA of about $47.6 billion (operating income of $29.3 billion plus $18.3 billion of depreciation and amortization), total net leverage is closer to 2.9x. The deterministic feature file could not classify the balance sheet (balance_sheet_class returns unknown), so these figures are computed from the filed statements.
The maturity schedule is a real wall, but a laddered one. No single year before 2031 requires more than the company generates in free cash flow.
Source: FY2025 Annual Report (Form 10-K), Note 7 Debt — maturities of long-term debt [3]. The 2031 bar aggregates all maturities thereafter.
The 2026 maturity of $17.3 billion is covered by a single year of free cash flow — $20.1 billion in 2025 (operating cash flow of $37.1 billion less $17.0 billion of capital expenditure) [4]. Behind that sits $12.0 billion of unused capacity under a revolving credit facility that has never been drawn since inception, carries no financial covenants, and requires no specified credit rating [5]. Roughly 79% of the debt is fixed-rate, so a 100-basis-point move in rates shifts annual interest by only about $340 million [6]. Refinancing risk is contained rather than absent: Verizon raised $27.6 billion of long-term borrowings in 2025 at coupons clustered around 4%–5%, close to its 5.0% blended rate, so rolling the ~$10–17 billion that comes due each year is broadly rate-neutral at today's curve [7]. Credit ratings did not change in 2025 or 2024 [8].
The balance sheet can outlast the problem. What it cannot do is fund large repurchases without contest: management's stated capital-allocation order puts network investment first, the dividend second, debt paydown third, and buybacks fourth [9]. Debt reduction is still an active claim on cash — leverage remains above target and management is still guiding to reach the target range in 2027 [10]. So repurchases are the residual, not the priority.
The repurchase record — executed, not authorized
For a decade the repurchase engine did not run. The diluted share count rose in every one of the last ten fiscal years, from 4.086 billion in 2016 to 4.231 billion in 2025 — a 145-million-share increase driven by stock-based compensation, not acquisitions of stock.
Source: derived from Verizon FY2016–FY2025 income statements; matches fit_features.share_count_trend (rising = true, 5-yr CAGR +0.43%) [11].
The framework treats a rising share count driven by SBC as a disqualifying signal for the repurchase pillar, and on the historical record Verizon meets that description. The prior authorization — 100 million shares approved in February 2020 — bought back nothing: "During the years ended December 31, 2025 and 2024, Verizon did not repurchase any shares," and the same was true in the years before [12]. The after-tax cost of stock-based compensation ran $815 million in 2025, $795 million in 2024 and $533 million in 2023 — small against a $196 billion company, but with no offsetting buyback it fell straight through to the share count [13].
The counter-fact is recent and genuine. On January 30, 2026 the board authorized a new $25 billion repurchase program, part of a plan to return roughly $55 billion to shareholders through 2028 [14]. This one is executing: $2.5 billion of stock was repurchased in Q1 2026 [15], and by the Q2 2026 call buybacks had reached $3.5 billion year-to-date — already past the original at-least-$3 billion full-year commitment — with the 2026 target raised to up to $4.5 billion [16].
The scale, though, is modest against the float. At up to $4.5 billion a year and a ~$46 share price, the program retires roughly 97 million shares annually — about 2.3% of the count, enough to reverse the SBC drift and begin a slow net reduction, not the multi-year halving the framework's levered exception requires. The record reads as an engine switched on in 2026 after a decade idle, not a demonstrated repurchase habit.
Management's buyback intent, from the record
The intent is now explicit, and it broke from the company's own prior doctrine. Under the previous CEO, buybacks were gated on leverage: "When we come down to 2.25 times, we have said we will start considering buybacks, but our ultimate long-term goal is to get around 2 times" [17]. The new team started buying at 2.5x — above the old 2.25x threshold — framing the stock itself as the reason: management raised the 2026 target citing "our conviction that Verizon's stock at current levels represents a compelling use of capital" [18].
Analysts have pressed on durability of the cadence, and here management stops short of a multi-year commitment: on the pace beyond the stated at-least-$3 billion, they declined to commit to specifics, citing hypotheticals (Calls). Insider buying has not accompanied the turn — Form 4 activity over the past year is confined to small restricted-stock and dividend-equivalent accruals, with no open-market purchases by officers or directors, and insider economic ownership is a fraction of a percent, as is typical for a company this size.
The levered exception
It does not apply. The exception is reserved for adjusted yields of roughly 25% or more, and Verizon's consensus forward free-cash-flow yield sits near 10%–11% (see Yield) — not in that zone. Even setting the yield aside, two of the three legs fail: the share count rose rather than fell over the multi-year window, and only the FCF-not-deteriorating leg is arguably met. Two of three is not the exception.
The absurdity check
The feature file returns float_retirement_years as not_computable because adjusted FCF is unavailable. On reported free cash flow the arithmetic is straightforward: a $196.2 billion market capitalization against $20.1 billion of 2025 free cash flow is about 9.8 years to retire the entire float — a normal high-single-digit multiple, not the ~3-year figure that flags a price making an impossible claim [19]. And because roughly 57% of that free cash flow is committed to the dividend, at the current buyback pace the float would take on the order of forty years to retire. The absurdity signal is absent here.
Dividend safety
The dividend is the most secure leg of the return, and at roughly 5.9% it is a material part of the case, so it is tested here. The annualized payout is $2.76 per share (the quarterly rate was raised 1.8% to $0.6900 in Q3 2025), against a $46.38 close [20].
2025 Free Cash Flow ($B)
2025 Dividends Paid ($B)
Source: FY2025 Annual Report (Form 10-K), Consolidated Statements of Cash Flows [21] and Free Cash Flow reconciliation [22].
Free cash flow of $20.1 billion covered the $11.5 billion of dividends paid 1.75x — a payout of 57% of free cash flow, leaving roughly $8.6 billion of headroom [23]. The record is the strongest evidence: 2025 marked the nineteenth consecutive year of a board-approved dividend increase, a streak that held through the 2008–09 crisis and the pandemic [24].
Source: Verizon FY2016–FY2025 Consolidated Statements of Cash Flows [25].
Management's commitment language is consistent: the ~$55 billion return-to-shareholders plan through 2028 counts the dividend first, and the board has continued to raise it while starting buybacks [26]. What would force a cut is narrow: a sustained collapse in free cash flow (which grew at roughly -1% a year over the prior five years before the 2026 inflection) colliding with the debt-paydown priority. At 1.75x coverage and a nineteen-year record, that is a low-probability path absent a large shock — but the flip side is that the payout grows glacially, near 1.8% a year, below inflation. This is a high-yield, low-growth dividend, secure rather than compounding.
Management credibility
The record is mixed but not promotional. Taking the most material promises from the transcript archive of two to four years ago:
Sources: Q4 2023 Earnings Call [27]; Q4 2024 Earnings Call [28].
The operational promises were kept: Verizon reported "delivering on all of our 2024 financial guidance," with wireless service revenue and adjusted EBITDA above the midpoint, and it hit the 4–5 million fixed-wireless target well ahead of the end-2025 date [29]. The one promise repeatedly stretched was capital return: buybacks were framed as an "eventual" step for years, the leverage gate was effectively reached by end-2024 (2.3x), and the program only arrived after a CEO change in early 2026. That is a delay, not a broken promise or a fabricated claim.
The new CEO's register is more promotional — "a structural and meaningful inflection," an ambition to be "an AI-native company" — but it is being cashed with raised guidance and executed buybacks rather than left as rhetoric, and the board extended his contract through 2028 [30]. The genuine weakness against the framework is skin in the game: insider economic ownership is minimal and no officer or director has bought stock in the open market during the turn. Low ownership plus a clean delivery record is a mild caution, not the promotional-CEO exclusion the framework screens for.
Clock
Verizon's re-recognition is already in motion, not waiting on a catalyst: a new-CEO operating inflection lifted free-cash-flow and EPS guidance twice in 2026, the buyback finally started, and C-Band capex is rolling off — mechanisms with dated 2026–2028 checkpoints. But the deep, forced-selling drawdown the framework hunts happened in 2023 and has largely re-rated; today's move is an 18% dip on no volume spike. Long-dated options exist; 30-day implied volatility sits near 26%.
The re-rating mechanism — what closes the gap, and when
The gap here is not a feared event that must fail to happen; it is a decade of roughly flat per-share cash flow that the market extrapolated forward. Over the five years to 2025, Verizon's average annual free cash flow and adjusted EPS each grew about negative 1% [1]. Four mechanisms are now pushing against that extrapolation, each with a calendar.
1. An operating inflection under new management, resetting guidance against a low bar. Dan Schulman took the CEO seat in October 2025; the Board extended his contract through December 31, 2028 on the Q2 2026 call [2]. Q2 2026 delivered consumer postpaid phone net adds described as the best in five years [3], and management raised full-year guidance for the second consecutive quarter: free-cash-flow growth to 9%–10% (from ~7%), adjusted EPS growth to 6%–7%, and mobility-and-broadband service revenue to 2.5%–3% [4]. The mechanism is a printed-numbers reset: each beat-and-raise quarter narrows the distance between the tape and a re-rating.
2. The buyback flywheel, starting now. In January 2026 Verizon authorized a share-repurchase program of up to $25 billion and committed to at least $3 billion of buybacks in 2026, inside a plan to return approximately $55 billion to shareholders through the end of 2028 [5]. On the Q2 call that 2026 target was raised to up to $4.5 billion, with $3.5 billion already executed [6]. This is a genuine inflection: the share count rose every year from 4.09 billion (2016) to 4.23 billion (2025), so 2026 is the first year the denominator is set to shrink rather than grow.
3. Capex rolling off as C-Band completes. 2026 capital spending is guided to $16.0–$16.5 billion, a program that includes completing the deployment of C-Band spectrum [7]. Capex has already stepped down from $18.8 billion (2023) to $17.0 billion (2025); the completion of the C-Band build removes the largest recent call on cash and is the arithmetic behind the free-cash-flow raise.
4. Deleveraging and a new growth vector, layered for 2027. Net unsecured debt to adjusted EBITDA was 2.5x at Q2 2026, with management targeting its leverage range "during the 2027 time frame" [8]; it also signed a Google dark-fiber agreement valued at over $1 billion and expects AI-infrastructure revenue to begin contributing in 2027 [9]. These are 2027–2028 stories, not 18-month ones.
Sources: FY2025 10-K, MD&A and Capital Expenditures [10] [11]; Q2 FY2026 earnings call [12] [13]. Earnings dates from the historical calendar.
One point cuts the other way and belongs on the record: the same capital that funds the buyback also has to fund the $22.3 billion Frontier acquisition (closed January 20, 2026) [14] and the stated debt paydown, so the repurchase is deliberately paced — up to $4.5 billion is roughly 2% of the $196 billion market cap in year one, not the double-digit denominator-shrink the framework's flywheel envisions. The tension between debt paydown and repurchase priority is developed in Self-Help.
Base rates — what a drawdown of this depth has done in Verizon's own history
Verizon is not a high-beta franchise whose price routinely swings far more than its value; its beta runs near 0.2. Its history shows infrequent, deep de-ratings that take years — not quarters — to round-trip, and the current episode sits inside one of them.
Source: derived from the run's daily price series; quarter-end closes, 2016–2Q26 close $46.38 (2026-07-24). Prices as traded, not dividend-adjusted.
The line tells the base-rate story directly. Verizon last saw the low-$60s at the end of 2019; it then de-rated to $30.67 in October 2023 — a 50.6% peak-to-trough decline over roughly 46 months — as C-Band capex, rising rates, and a 2023 lead-sheathing scare compounded. Off that October 2023 low it rallied 67.5% to a $51.38 high in March 2026, the actual re-rating the framework would have captured. At $46.38 today, the stock is still about 25% below its 2019 peak, six-plus years on.
Source: derived from the run's daily price series (peak-to-trough close, drawdown measured from the running post-2000 high). Pre-2010 figures use the Bell Atlantic/Verizon continuous series and are unadjusted for dividends.
The read from Verizon's own record: comparable-depth drawdowns (40%+) are rare and slow to reverse. The 2000–2008 de-rating took roughly eighteen years to fully round-trip; the current 2019–2023 episode is more than six years old and unrecovered. Verizon has no history of a Meta-style vertical snap-back, and its low beta says not to expect one — the base rate is a multi-quarter grind, powered by cash return and printed beats, not a violent re-rating.
Two facts qualify how "dislocated" today actually is. The 2023 capitulation — the deep, high-fear low the framework prizes — has already happened and largely re-rated. The move on the table now is a March-to-July 2026 dip of 18.3% that arrived on a volume multiple of just 1.2x the prior-180-day median — not the forced-selling spike the framework requires — and the stock has already bounced roughly 10% off the July 1 low. The full drawdown anatomy and capitulation gauge live in Dislocation.
The 18-month test
Because the mechanism is a cash-flow-and-guidance grind rather than an industry-wide mispricing snapping back, re-recognition on an 18–24-month horizon is a reasonable expectation only in the modest sense already visible in the tape: two guidance raises, a starting buyback, and a stock up ~10% into the July print. A larger re-rating toward the 2019 highs is a years-of-execution proposition — Verizon's own base rate says deep de-ratings take multiple years to reverse, and the growth vector that would justify a higher multiple (AI-infrastructure revenue) only begins contributing in 2027. This read fails if free cash flow or EBITDA — guided up 9%–10% and 7% for 2026 — stops rising, or if the capital-allocation priority visibly pivots from repurchases back to debt paydown; both are carried in the falsifier ledger and tie to Yield and Durability.
What consensus expects, and when
The sell side is neither capitulated nor crowded-in — it is lukewarm. Per consensus estimates, the recommendation mix is 15 holds, 11 buys, and zero sells, with a mean price target of $50.95 (median $51, range $43–$71) against a $46.38 close — roughly 10% implied upside. That positioning leaves room to upgrade: no capitulated sell-side means the re-rating fuel is analysts moving from hold to buy as beats accumulate, not a short-squeeze off maximum pessimism.
Consensus does not need to underwrite mean reversion here — it already models the recovery in printed numbers. Street free-cash-flow estimates imply a forward yield of 10.1% on FY2025, rising to 11.0% (FY2026), 11.6% (FY2027) and 15.1% (FY2029) on today's market cap; the sell side already has cash flow clearing a double-digit bar, which the framework reads as agreement rather than a contrarian call (the yield computation and its bar sit in Yield).
Source: consensus free-cash-flow estimates (CapIQ via the run's estimate feed) divided by the $196.2B market cap in fit_features.consensus_forward_yield; derived.
The candidate quarter that would let re-rating show up in the print is Q3 FY2026 (reporting late October 2026) — management guided mobility-and-broadband service revenue to approach 3% growth, and a third straight beat-and-raise on that line would be the first quarter where accelerating revenue, not just cost-driven EPS, carries the story. Q4 FY2026 (late January 2027), guided to ~4% revenue growth and closing the first full buyback year, is the confirming print. Verizon has now beaten normalized-EPS consensus eight quarters running, so an EPS beat alone is largely discounted; the revenue re-acceleration is the variable the market has not yet paid for.
Instrument facts
These are facts about listed instruments, stated as facts — not suggestions, and not advice.
- Long-dated options exist. Verizon carries listed equity options with expirations extending to January 2028, roughly 18 months beyond the July 2026 reference date — inside the framework's ≥12-month, ideally-18-month window. As a ~$196 billion component of the major indices, the options are among the more actively traded single-name lines, with open interest spread across both calls and puts (open-interest put/call ratio near 0.7).
- Implied volatility is low. Verizon's 30-day mean implied volatility was 25.58% as of July 24, 2026 (per AlphaQuery's option-statistics page) — well below the framework's reference lines (up to ~50–55 acceptable, 60–70 elevated). The reading is consistent with the stock's low beta (~0.2). A transient spike into the 80s appeared in the single-day options expiring on the July 24 earnings date, which is the ordinary event premium that collapses after a print; the standing 30-day level is the low-20s-to-high-20s figure above.
- Sourcing note. The pre-run web-research pass was unavailable for this run (provider credit exhausted), so these instrument facts were gathered by direct search; the implied-volatility figure carries its dated source above rather than an estimate.
Verizon clears the framework's instrument gate on existence and duration, and its implied volatility is at the inexpensive end of the reference lines — the opposite of the too-high-IV problem the framework flags. What it does not offer is the deep, high-fear entry the same framework is built around, for the reasons the price history above makes plain.